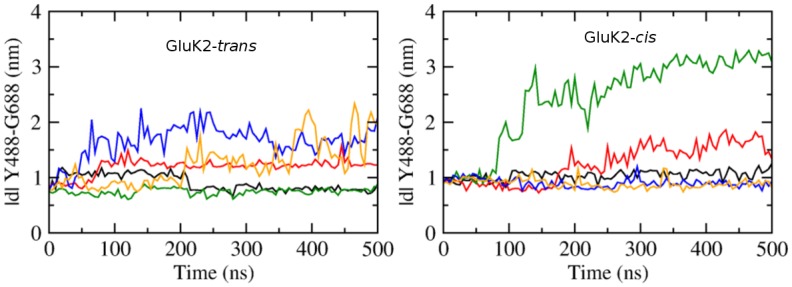
Fig 4. The opening extent of the LBD clamshell in the course of MD simulations, described with the center-of-mass distance of Y488 and G688.

Left: GluK2-trans complex; right: GluK2-cis complex. Data obtained from five independent simulations of 500 ns each, for each of the complexes. The black, red, green, blue, orange curves correspond to the simulations #1, #2, #3, #4, #5, respectively.
