
Fig 7. Ligand–protein interactions in the GluK2-trans complex.
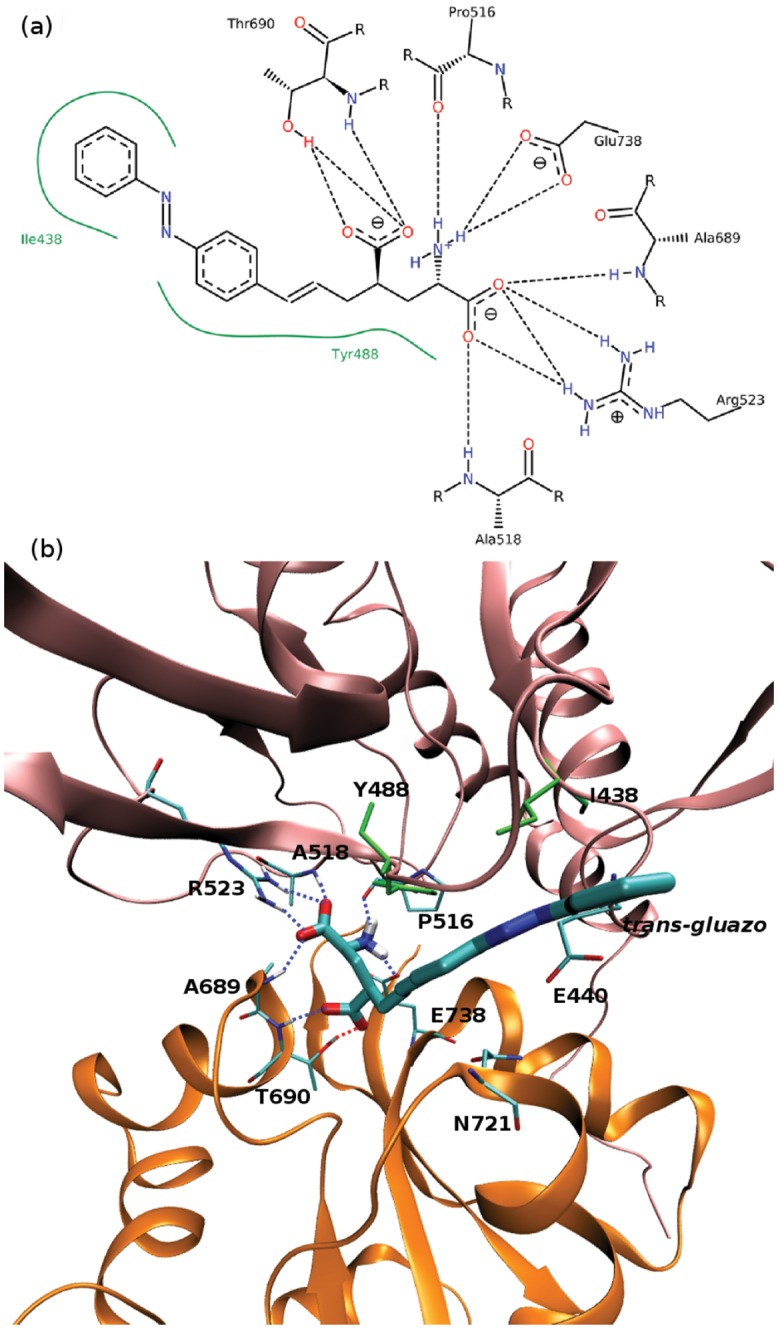
(a) 2D diagram of the ligand–protein interactions generated by PoseView.[45–47] Blue and red dashed lines—hydrogen bonds, green dashed lines—π-cation interactions, green lines—hydrophobic interactions. Default parameters were used to identify the interaction patterns, as presented in the manual at http://www.biosolveit.de/poseview. (b) 3D diagram of the ligand–protein interactions. Tubes colored by atom—ligand and contacting residues within the receptor, cartoon mode—receptor, pink—LBD D1 domain, orange—D2 domain, green—residues engaged in hydrophobic interactions with the ligand, dotted lines—hydrogen bonds.