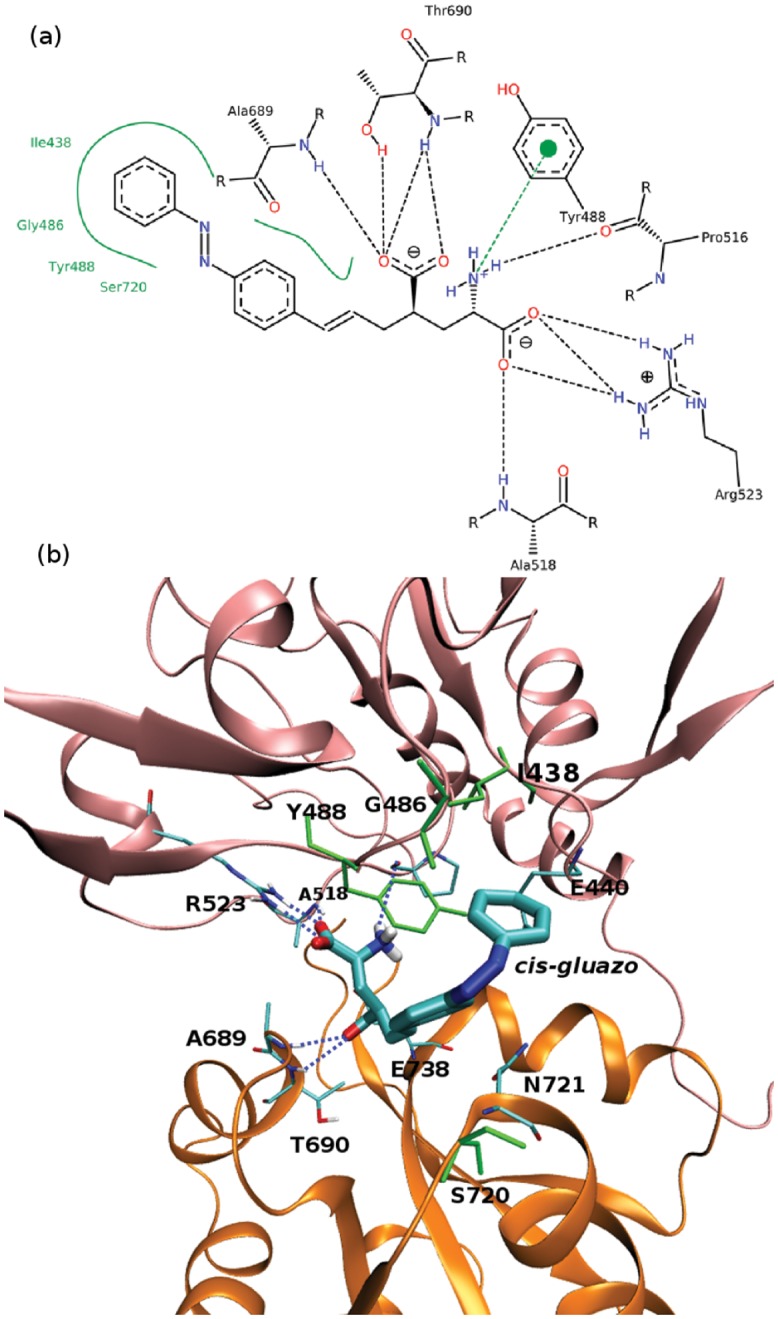
Fig 8. Ligand–protein interactions in the GluK2-cis complex.

(a) 2D diagram of the ligand–protein interactions. See the caption to Fig 7a for legend. Note that the used software cannot distinguish between the different configurations of gluazo, and so cis-gluazo is displayed in the trans configuration. (b) 3D diagram of the ligand–protein interactions. See the caption to Fig 7b for legend.
