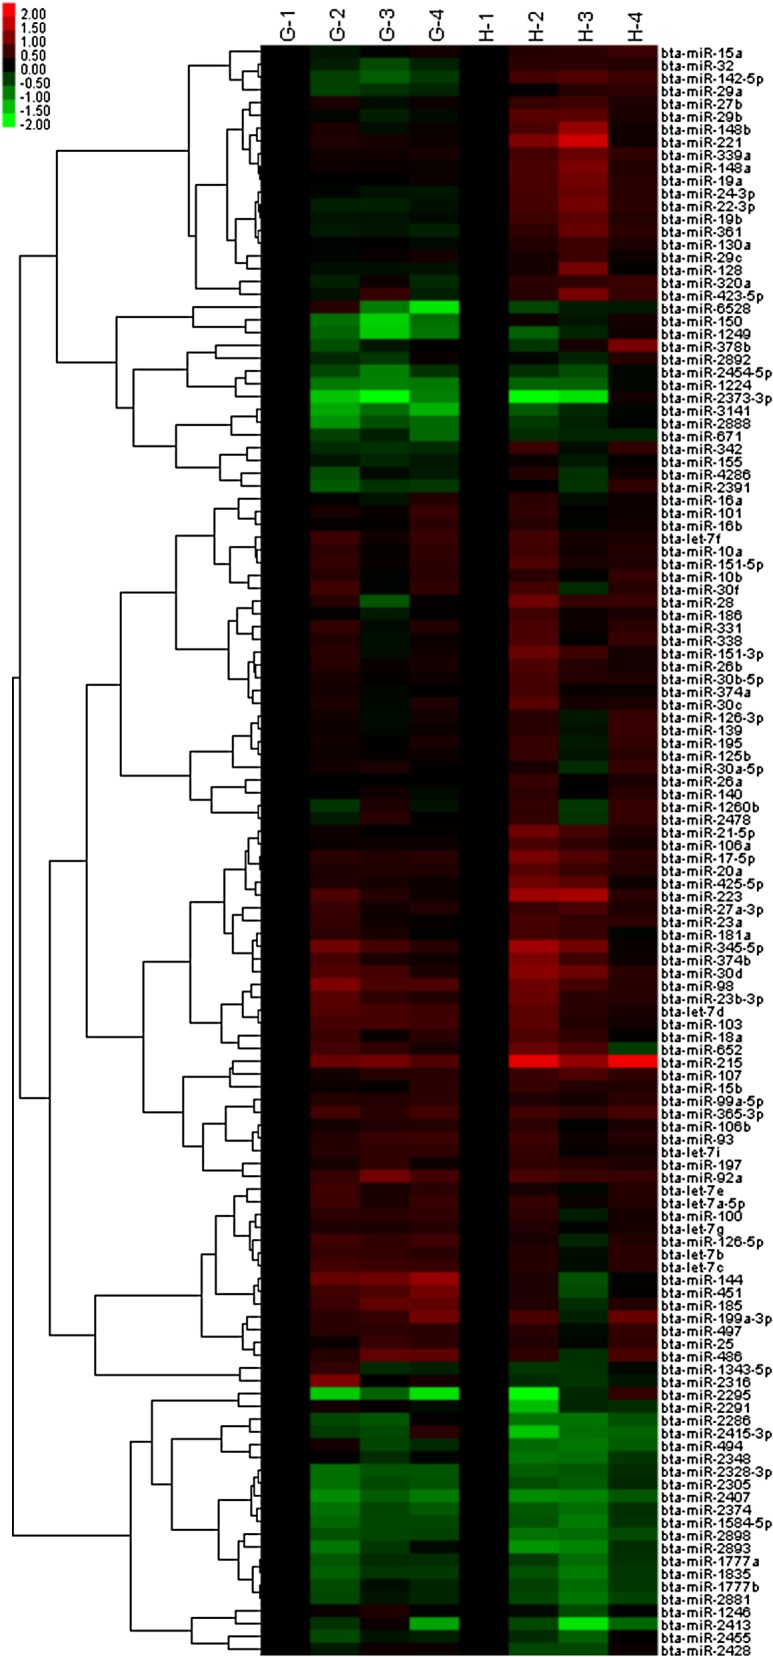
Fig 5. Hierarchical clustering result of microarray analysis for 131 exosomal miRNAs in plasma of grazing and housed cattle.

The hierarchical clustering was performed using log-transformed values of miRNA expression levels at 0, 1, 2, and 4 mo in plasma exosome samples of grazing cattle (G-1, G-2, G-3, G-4) and (H-1, H-2, H-3, H-4). The values of G-2, G-3, and G-4 samples were normalized by that of G-1, while values of H-2, H-3, and H-4 samples were by that of H-1.
