
Fig 4. Expressions of IP and TP receptors in HTN carotid arteries.
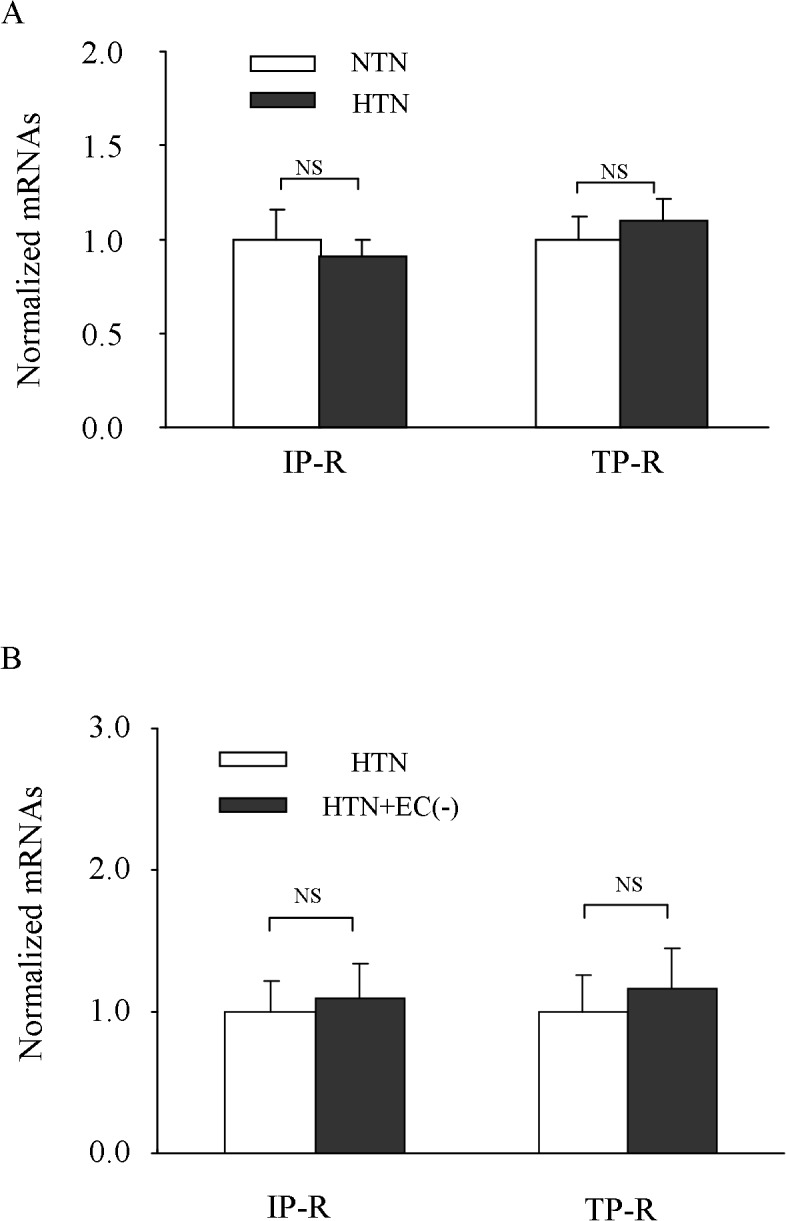
A: comparison of mRNA levels of IP and TP receptors detected with real-time PCR between HTN and NTN arteries (normalized to β-actin with the average value of NTN vessels assumed as 1.0; n = 6 for each). B: β-actin normalized levels of IP and TP receptor mRNAs in HTN arteries and those denuded of the endothelium [HTN + EC (-)] with the average value of control HTN vessels assumed as 1.0 (n = 3 for each). Values were expressed as mean ± SEM; NS, not significant.