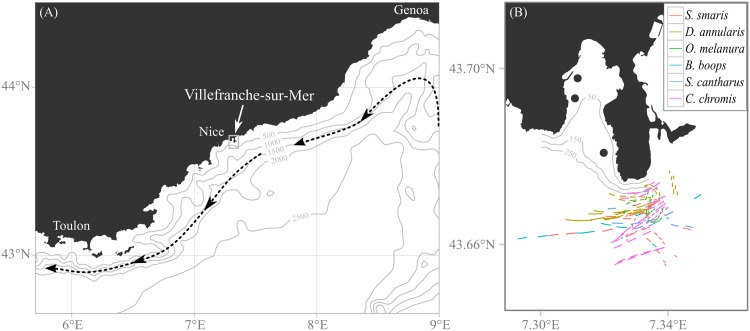
Fig 1. (A) General location of the study area and (B) detailed map of collection sites and deployments.
(A) Black arrows represent the average Ligurian current trajectory. Grey lines are isobaths (in meters). The white arrow points the study site (Villefranche-sur-Mer) shown in subplot (B). Nice, Toulon and Genoa are the three main cities in the region. (B) The three black dots represent collection sites of settlement-stage fish larvae. Segments represent the drifting trajectories of the instrument over each 15 min deployment. Grey lines are isobaths (in meters).

