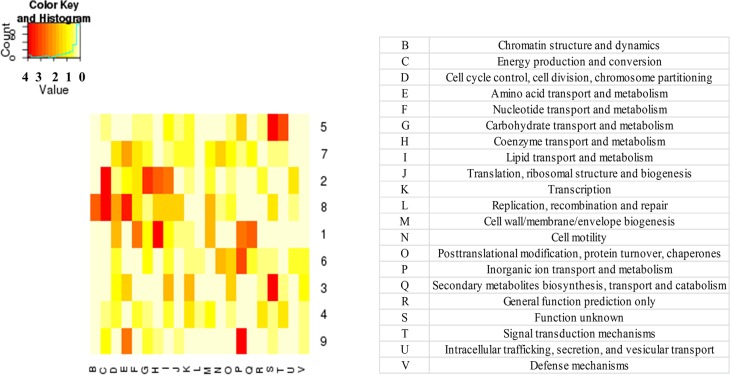
Fig 4. Gene Set Enrichment Analysis (GSEA) in the clusters of differentially expressed genes of Arthrospira sp. PCC 8005 in response to gamma irradiation based on the Clusters of Orthologs Groups (COG) functional categories.
This plot visualises whether a certain gene cluster (1–9, on the vertical axis) is containing a higher number of representatives of a specific COG (21 different COGs, on the horizontal axis) then would be expected by chance. The COG functional category is shown in the vertical direction, the clusters of differentially expressed genes in the horizontal direction. The colour code is according to the 10log value of the corresponding p-value of the GSEA analysis: a p-value of smaller than 1.10–4 (10log-value of 4) results in a colour code red, a p-value of 1 (10log value 0) results in colour code white.

