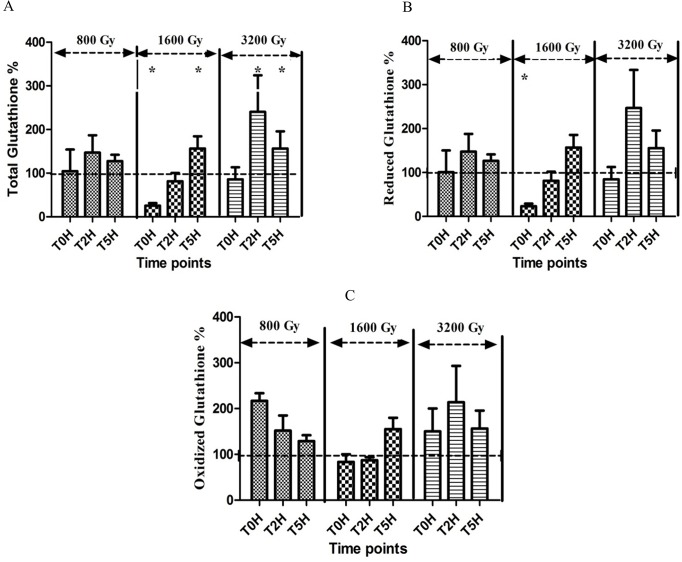
Fig 5. Intracellular glutathione concentrations of Arthospira sp. PCC 8005 after irradiation.
A, B and C show the normalised intracellular concentrations of respectively total glutathione (GSH+GSSG), reduced glutathione (GSH) and oxidized glutathione (GSSG) immediately (T0H), 2 hours (T2H) and 5 hours (T5H) after irradiation.
The data obtained for the irradiated samples were normalized against and are shown as percentage of their representative non-irradiated control (which was put at 100%). Data represent the mean of three independent biological replicates, and error bars present the standard error of the mean (SEM). The statistical analysis was calculated on the raw data, before normalisation to percentages. One asterisk indicates a value which is significantly (p<0.05) different from the value of the non-irradiated control.

