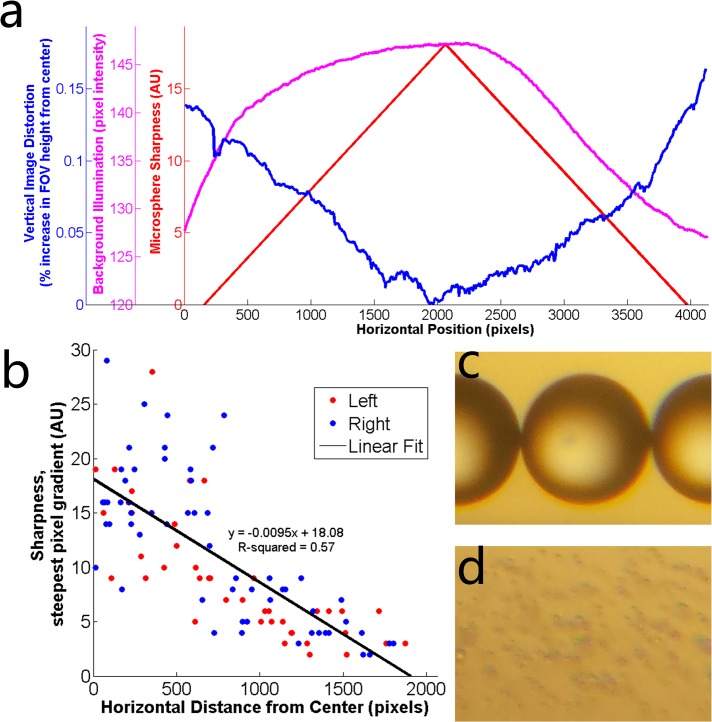
Fig 3. Optical quantification of density-based magnetic levitation.
(a) Quantification of image distortion (blue), background illumination (magenta), and microsphere sharpness (red) along the horizontal field of view. Microsphere sharpness is shown as the line of best fit for the data shown in (b). (b) Data points representing sharpness of microspheres located at different distances from the center of the field of view. The line of best fit approximates the decrease in image sharpness as the distance from the centerline increases. Red data points represent microspheres located to the left of the centerline and blue data points represent microspheres located to the right of the centerline. (c) 210 μm and (d) 5.25 μm diameter microspheres demonstrating qualitatively the optical resolution of the platform.

