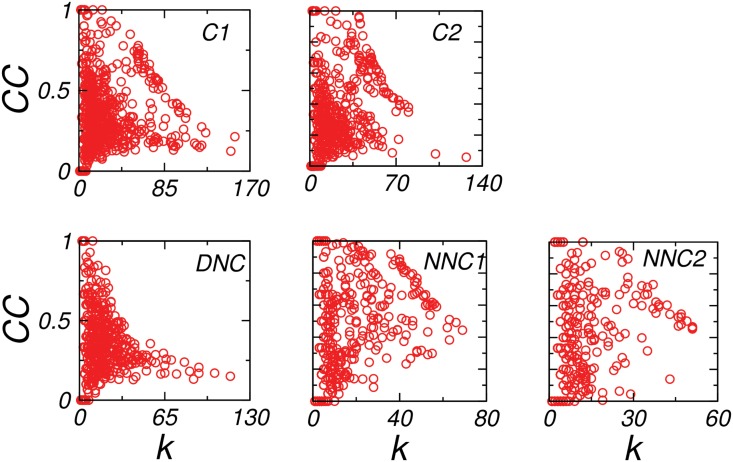
Fig 4. Degree-Clustering coefficient correlation.
The figure showed k−CC correlation of the common (C1 and C2), disease not common (DNC) and normal not common (NNC1 and NNC2) networks, while the common and DNC networks reflected less random correlation, normal not common exhibited more towards random correlation.

