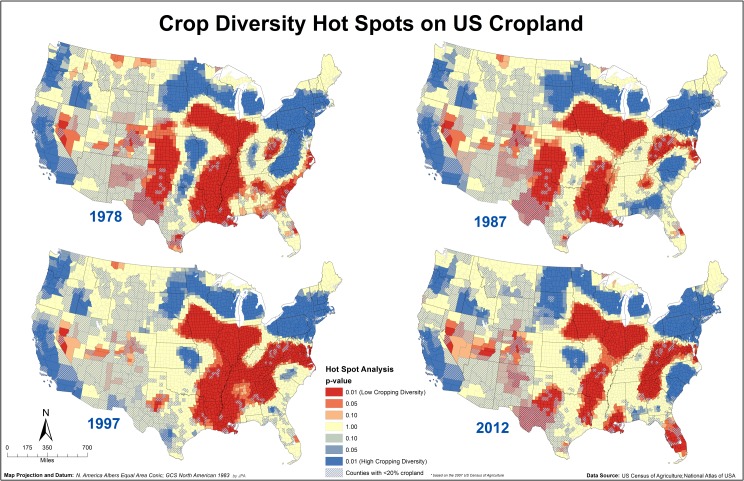
Fig 5. Crop species diversity hot spots based on the geostatistical analysis of the ENCS values for 1978, 1987, 1997 and 2012.
Hot (red hues) spots are areas with significant clustering of counties with low ENCS values (low cropping diversity) and cold (blue hues) spots are clustering of counties with high ENCS values (high cropping diversity). Maps showing hot spot analysis for all Census years are available in S2 Fig.

