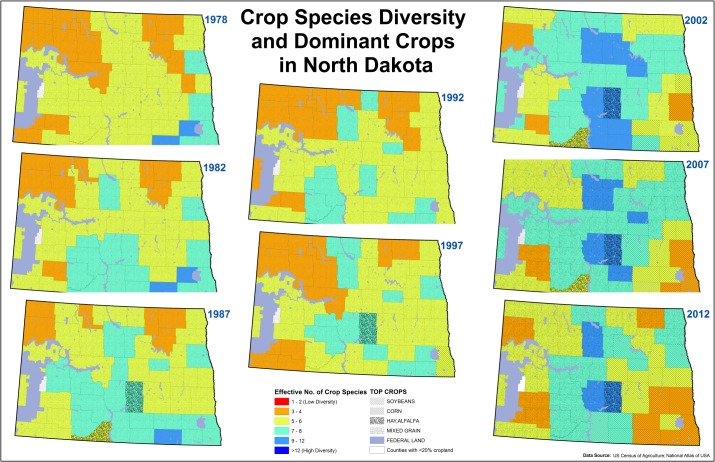
Fig 6. Crop Species Diversity and Dominant Crops in North Dakota.
Solid colors indicate crop species diversity and federal lands while the overlayed pattern indicate the dominant crop for that county. The hotter colors (red hues) indicated lower ENCS values (low crop diversity) while colder colors (blue hues) indicate higher ENCS values (high crop diversity).

