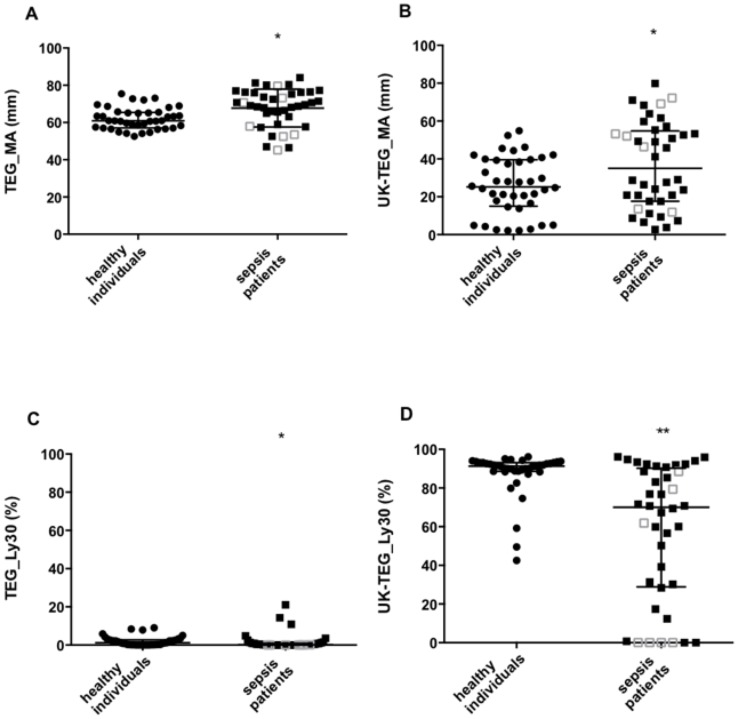
Fig 2. Distribution of MA and Ly30 measured by TEG and UK-TEG in healthy individuals and sepsis patients.
Column scatter-plot for TEG_MA (Panel A), UK-TEG_MA (Panel B), TEG_Ly30 (Panel C) and UK-TEG_Ly30 (Panel D) in healthy individuals (circles) and sepsis patients (squares). Filled squares represent sepsis patients with SOFA score ≤ 10 (lower severity of disease), clear squares represent sepsis patients with SOFA score > 10 (higher severity of disease). Horizontal lines represent median (25th- 75th). * p<0.05, *** p<0.001, p value from Mann-Whitney test. TEG_MA, MA measured by TEG, UK-TEG_MA, MA measured by UK-TEG, TEG_Ly30, Ly30 measured by TEG, UK-TEG_Ly30, Ly30 measured by UK-TEG.

