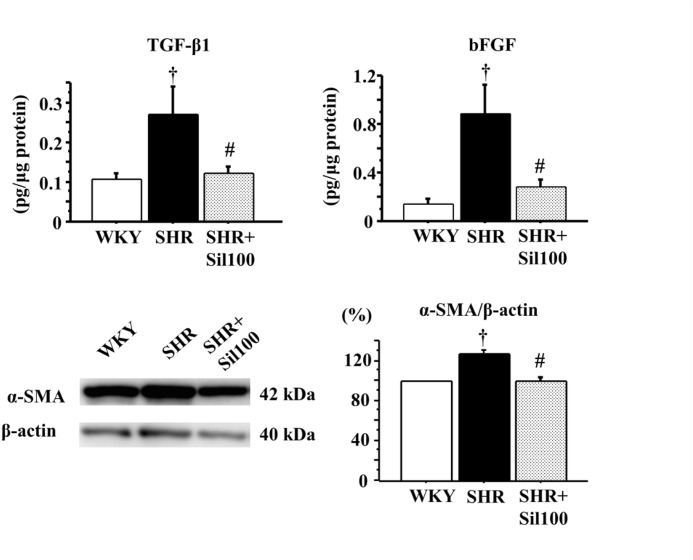
Fig 4. TGF-β1, bFGF and α-SMA levels in the ventral prostate.
Tissue levels of TGF-β1 (left upper panel), bFGF (right upper panel), α-SMA (right lower panel), and a representative blot of α-SMA in the ventral prostate (left lower panel) are shown. WKY: 18-week-old Wistar-Kyoto rat group; SHR: 18-week-old SHR group; SHR+Sil100: 18-week-old SHRs treated with silodosin at a daily dose of 100 μg/kg, p.o.. Data are shown as mean ± SEM of eight separate determinations in each group. †: Significantly different with the WKY group; #: Significantly different with the SHR group (P < 0.05 is a level of significance).

