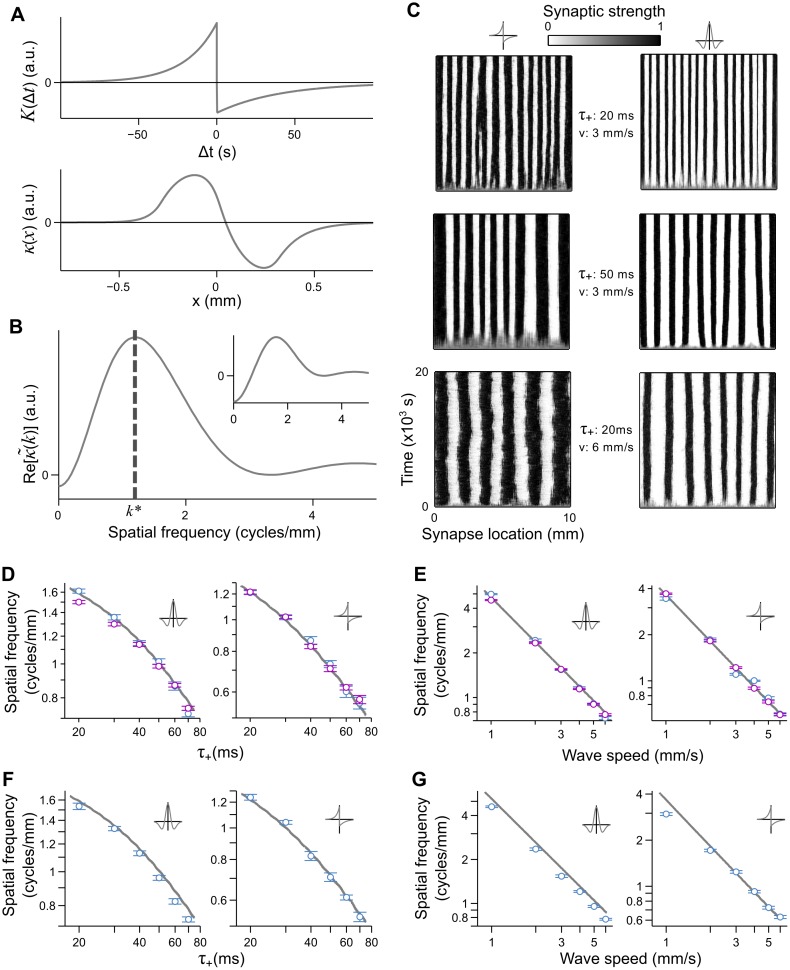
Fig 2. Traveling waves build periodic connectivity patterns into the synaptic strengths through STDP.
A. Example of a STDP rule (top panel, τ + = 20 ms, τ − = 40 ms, A + = 1.0, A − = 0.51) that is mapped into a location-dependent plasticity rule (bottom panel) by a wave traveling at 3 mm/s (burst duration is 0.1 s). B. Re[] for the STDP rule in A. The dominant spatial frequency, k*, lies where has a global maximum. Inset: for a symmetric STDP rule (τ + = 20 ms, v = 3 mm/s). C. Evolution of the synaptic strengths, initialized with strength 0.5, from 500 input neurons to a single output neuron, under the influence of an asymmetric (left column) and symmetric (right column) STDP rule. Waves sculpt a periodic connectivity pattern into the synaptic strengths with a spatial frequency equal to k* (see B and Eq 5). Larger values for τ + (controls STDP rule width) or v (wave speed) produce lower spatial frequencies in the periodic pattern. Values for τ + and v are given between the columns. D–E. Log-log plots for the spatial frequency of the steady state connectivity pattern as a function of τ + and v, for both the symmetric (left panels) and asymmetric (right panels) STDP rules. Grey curves: predicted k*; blue: mean spatial frequency ± SEM of the final connectivity pattern in the spiking simulation; purple: mean spatial frequency ± SEM of w(x) in the numerical solution to Eq 6. D. Dependence of the dominant spatial frequency on τ +, keeping v = 3 mm/s fixed. E. Dependence of the dominant spatial frequency on v, keeping τ + = 20 ms fixed. F–G. Same as D and E, but for an integrate and fire output neuron model.

