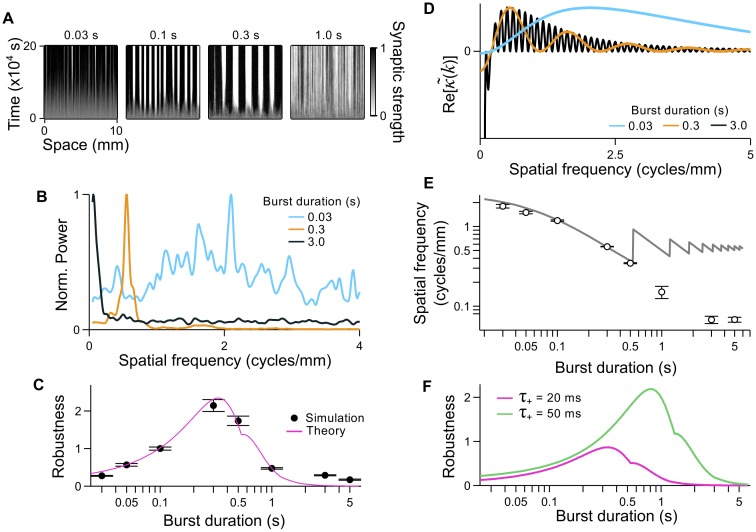
Fig 4. The influence of burst duration on pattern formation.
A. Examples of synaptic strength evolution over time. Numbers along the top indicate the input burst duration in seconds. B. Mean power spectra, normalized by the peak power in each spectrum, of the final connectivity patterns in simulations using burst durations of 0.03 s (blue), 0.3 s (orange), and 3.0 s (black). C. Robustness of the periodic connectivity pattern to different burst durations. Reference power spectra are taken from simulations with a burst duration of 0.1 s. Black: robustness measures for each burst duration. Pink: theoretical robustness measure, based on the concentration of power at k* in , normalized to the theoretical robustness for a burst duration of 0.1 s. D. Examples of for burst durations of 0.03 s (blue), 0.3 s (orange) and 3.0 s (black). The negative lobe in the black curve extends beyond the horizontal axis and has been cut for clarity. E. Spatial frequencies of connectivity patterns that developed in simulations as a function of the burst duration (black circles and error bars: mean ± SEM). Grey line: predicted spatial frequencies. The sawtooth fluctuations at longer burst durations correspond to the emergence of new dominant peaks in , which is compressed towards lower spatial frequencies as the burst duration is increased. F. Theoretical robustness as a function of burst duration for asymmetric STDP rules with τ + = 20 ms (pink) and τ + = 50 ms (green).

