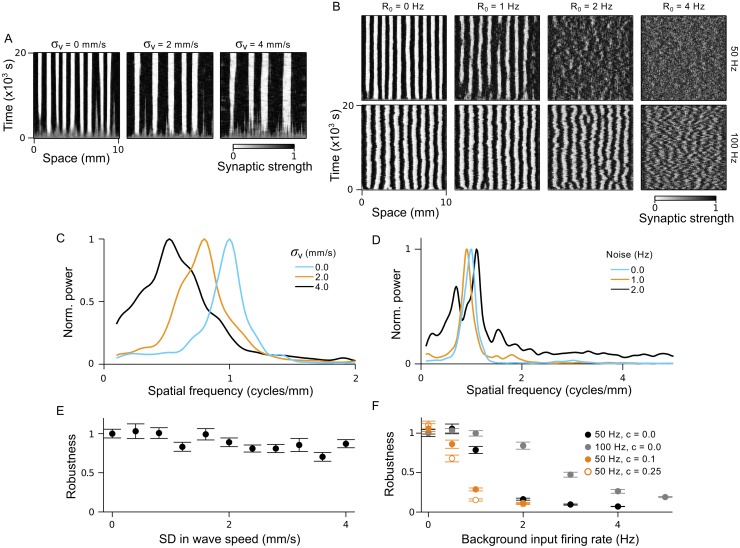
Fig 5. Robustness of periodic connectivity pattern to variation in wave speed and background input spikes.
A & B. Examples of synaptic strength evolution over time for simulations in which: A) wave speeds were drawn from a lognormal distribution with mean 4 mm/s and standard deviation σ v; B) a background firing rate of R 0 was assigned to input neurons. The firing rate during a wave burst was 50 Hz (top row) or 100 Hz (bottom row). C & D. Mean power spectra for the connectivity patterns, normalized by the maximum in each spectrum, for simulations in which: C) wave speeds were drawn from a lognormal distribution with σ v = 0 mm/s (blue), σ v = 2 mm/s (orange) and σ v = 4 mm/s (black); D) input neurons were assigned a background firing rate of 0.0 Hz (blue), 1.0 Hz (orange) and 2.0 Hz (black), with 50 Hz firing rates during a wave burst. E & F. Robustness of periodic connectivity patterns to: E) variation in wave speed, where reference power spectra are from simulations with σ v = 0; F) background spiking of input neurons, where reference power spectra are from simulations with R 0 = 0. Black: 50 Hz firing rate during a wave. Grey: 100 Hz firing rate during a wave. Orange: 50 Hz firing rate during a wave, with local input correlations of strength c = 0.1 (closed circles) and c = 0.25 (open circles).

