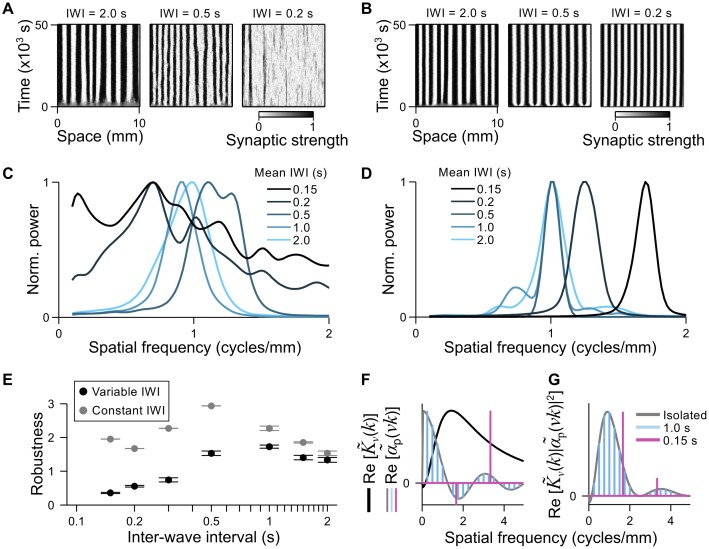
Fig 6. Robustness of periodic connectivity patterns when multiple waves traverse the inputs simultaneously.
A & B. Examples of synaptic strength evolution over time for simulations in which: A) waves are generated with IWIs drawn from an approximately lognormal distribution; B) waves are generated regularly with a constant IWI. C & D. Power spectra for the connectivity patterns, normalized by the maximum in each spectrum, for simulations in which: C) IWIs are drawn from a lognormal distribution. Light blue to black corresponds to mean IWIs of 2.0 s, 1.0 s, 0.5 s, 0.2 s and 0.15 s, respectively; D) IWIs are constant. Color scheme the same as for C. E. Robustness of connectivity patterns as a function of the mean IWI. Reference power spectra are taken from simulations with a constant IWI of 5 s. Black: IWIs drawn from a lognormal distribution. Grey: IWIs are constant. F. An example of (black) and examples of for a single wave in isolation (grey) and multiple waves with constant IWIs of 1 s (blue) and 0.15 s (pink). G. Examples of for the same IWIs in F.

