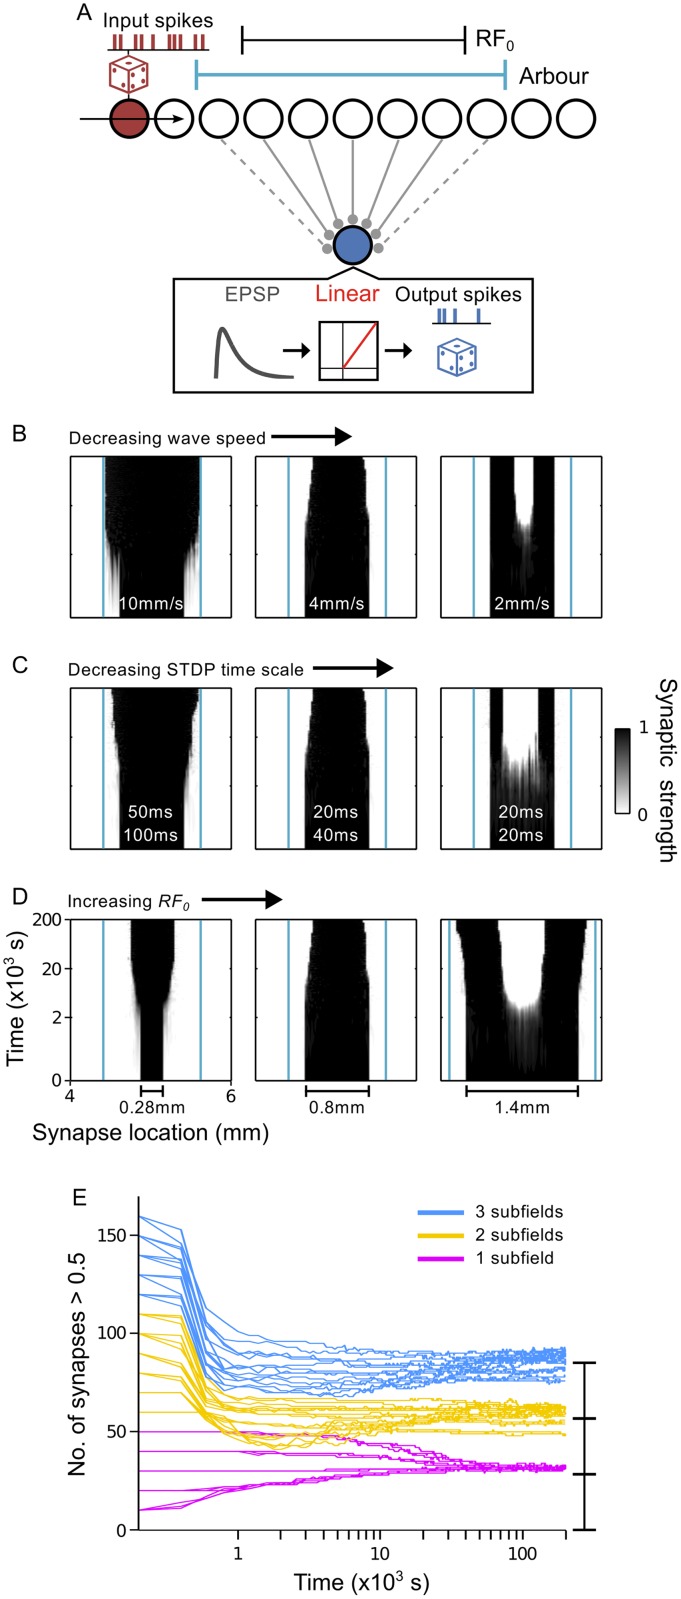
Fig 7. Refinement of receptive fields.
A. Schematic of network architecture for simulations investigating RF development. Grey solid connectors: synapses at maximal strength comprise the initial RF. Grey dashed connectors: synapses with zero strength at the start of the simulation but are modifiable, as they lie within the arbor function (teal). B–D. Examples of RF development over time for different RF 0, v and τ + combinations. Teal lines mark the boundary of the arbor function. B. Left → centre → right: v = 10 mm/s, 4 mm/s and 2 mm/s, keeping τ + = 20 ms and RF 0 = 0.8 mm fixed. C. Left → centre → right: τ + = 50 ms, 20 ms and 20 ms, τ − = 100 ms, 40 ms and 20 ms, A − = 0.55, 0.55 and 1.1, keeping v = 4 mm/s and RF 0 = 0.8 mm fixed. D. Left → centre → right: RF 0 = 0.28 mm, 0.8 mm and 1.4 mm, keeping v = 4 mm/s and τ + = 20 ms fixed. E. Development of the mean number of synapses with strength > 0.5 in simulations using RF 0 values from 0.2 mm to 3.2 mm in steps of 0.2 mm. Traces tend towards one of three values, depending on the number of subfields that develop. Blue: RFs split into three subfields; yellow: RFs split into two subfields; purple: RFs maintain just a single field.

