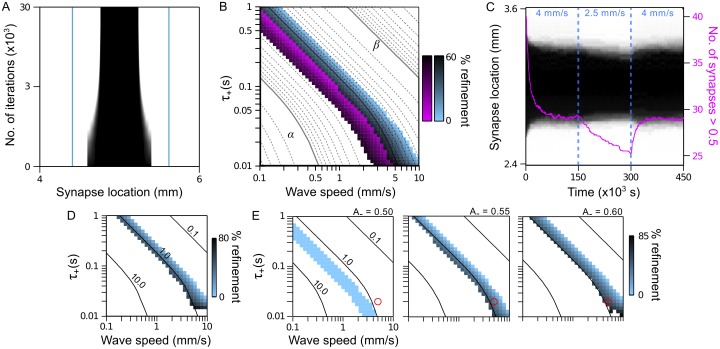
Fig 8. Relationship between periodic patterning and receptive field refinement.
A. Example of RF refinement obtained by numerically solving Eq 6. Vertical teal lines denote the arbor function boundary. B. Refinement phase space for RFs as a function of wave speed and STDP time constants. Colored regions: areas of phase space in which RFs maintain a single field that is refined to smaller sizes; blue: RF 0 = 0.8 mm; purple: RF 0 = 0.44 mm. Shading indicates the total change in RF size as a percentage of RF 0. Region α corresponds to higher spatial frequencies in which RFs split into subfields. Region β corresponds to lower spatial frequencies in which RFs expand. Overlaid are the iso-frequency contours of Fig 3. Solid contours correspond to spatial frequencies with integer exponents of 10 (lower left to upper right: 10 cyc./mm, 1 cyc./mm and 0.1 cyc./mm). C. Incremental changes in wave speed can continually refine RFs while maintaining a single subfield structure. Shown is the development of a RF, averaged over 16 trials, during which the wave speed is first set to 4 mm/s and then decreases to 2.5 mm/s, after which the RF decreases in size. Increasing the wave speed back to 4 mm/s returns the RF to its previous refined size. Purple trace: plot of the mean number of synapses with strength > 0.5 as an indicator of RF size. D. Refinement phase space using a symmetric STDP rule, for which RF 0 matches that for the blue region in B. Numbers next to the iso-frequency contours indicate their spatial frequency in cycles/mm. E. Refinement phase spaces, using the asymmetric STDP rule, for different biases towards synaptic weakening. Left: A − = 0.50, which corresponds to . Centre and right: A − = 0.55 and 0.60, respectively, which correspond to . Red circles lie at the same v and τ + coordinates, to compare the effect of different A − values on RF refinement. The refinement phase space moves to lower spatial frequencies as A − increases.

