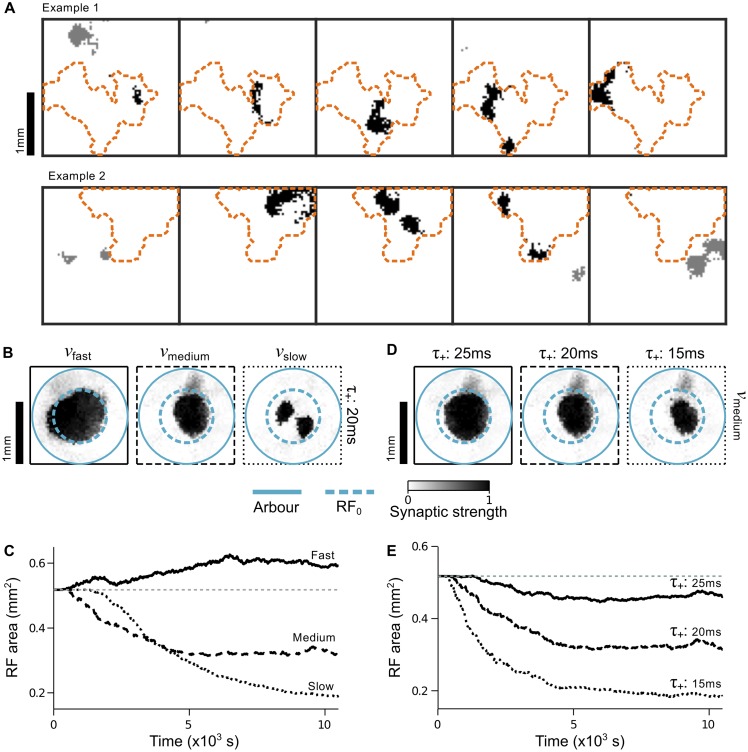
Fig 10. Refinement of RFs by complex wave patterns.
A. Snapshots of two example waves generated by the complex wave model, with time increasing from left to right in steps of 0.4 s. Dashed orange curves mark the spatial boundaries within which activity was assigned to the same, isolated wave. Black pixels mark input neurons that fired at least one spike during a 0.1 s interval and were part of the isolated wave. Grey pixels mark input neurons that fired at least one spike but were not part of the isolated wave. The analysis of each isolated wave excluded activity from outside the orange boundary. B. Example final RFs that developed under different wave speeds, holding the asymmetric rule fixed with τ + = 20 ms. Left: fast wave speeds; middle: medium wave speeds; right: slow wave speeds. Solid teal circles denote the boundary of the arbor function. Dashed teal circles denote the initial RF size. C. Summary of the development of RF areas under the influence of fast (solid black line), medium (dashed black line) and slow (dotted black line) waves, averaged over three trials. Dashed grey line: initial RF area. RF areas were calculated by multiplying the number of synapses with strength > 0.5 by the input cell spacing (34 μm) squared. D. Example final RFs that developed under different time scales of an asymmetric STDP rule, holding the wave speed fixed with medium speed waves. Left: τ + = 25 ms; middle: τ + = 20 ms; right: τ + = 15 ms. Teal circles the same as in B. E. Summary of the development of RF areas under the influence of different STDP time constants, averaged over three trials. Solid black line: τ + = 25 ms; dashed black line: τ + = 20 ms; dotted black line: τ + = 15 ms. Dashed grey line: initial RF area.

