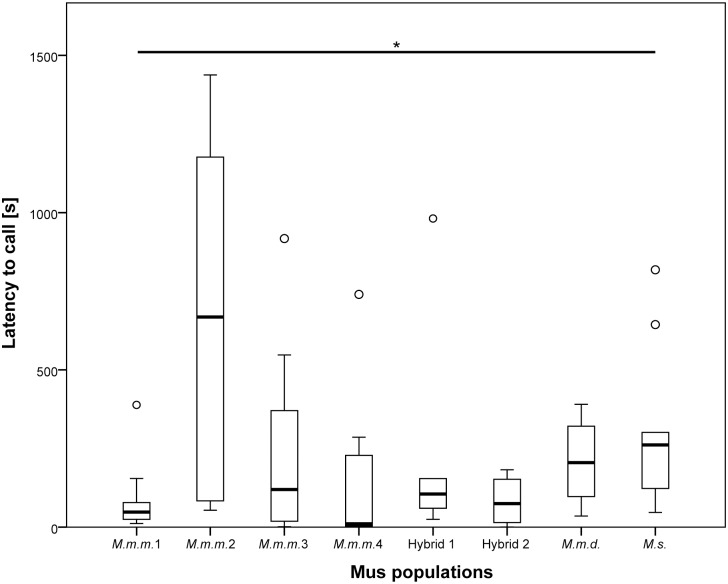
Fig 2. Latency to vocalize of males of different Mus populations.
N = 10, except for Hybrid 1 = 5, Hybrid 2 = 7 and M.m.d. = 4. Significant differences were observed among populations (p = 0.026). The box represents the interquartile range that contains the middle 50% of values. The thick line across the box indicates the median. Upper and lower whiskers limits are set to 1.5 x interquartile range above and below the third and first quartile. Outliers shown as circles. The asterisk represents significance at a level of p < 0.05.

