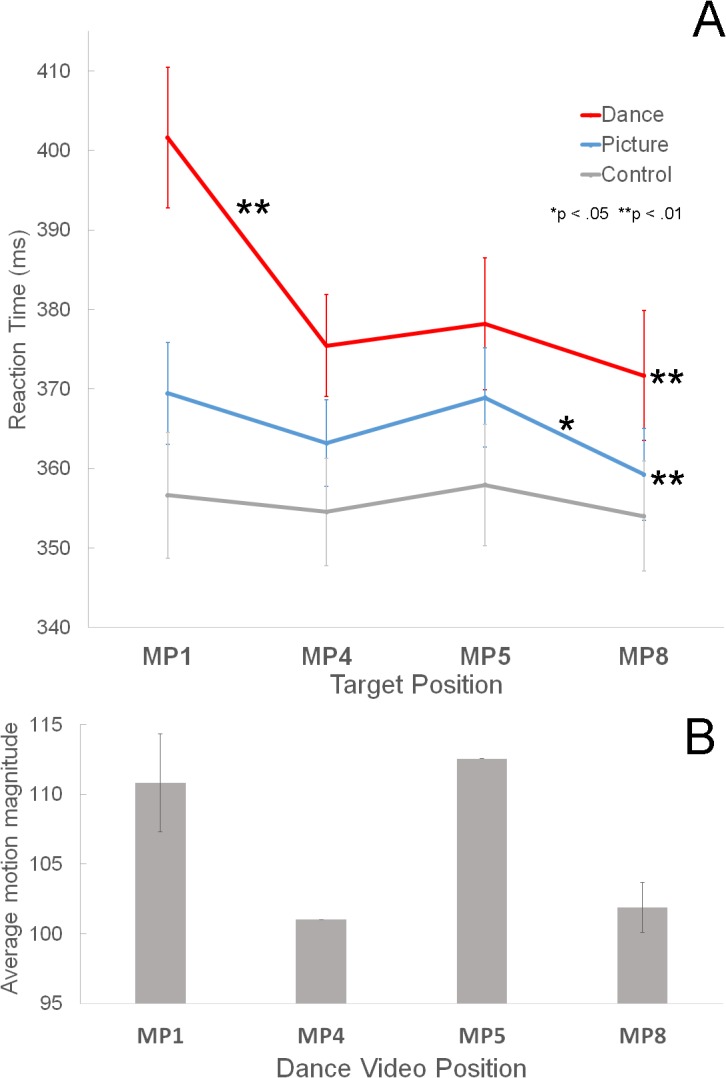
Fig 4. Results of Experiment 1.

A. The mean RTs for the four metrical positions for each condition when averaged across measure. Error bars represent ± SE. * p < 0.05, ** p < 0.01 B. The mean motion magnitude of the dance video corresponding to each metrical position. Error bars represent ± SD.
