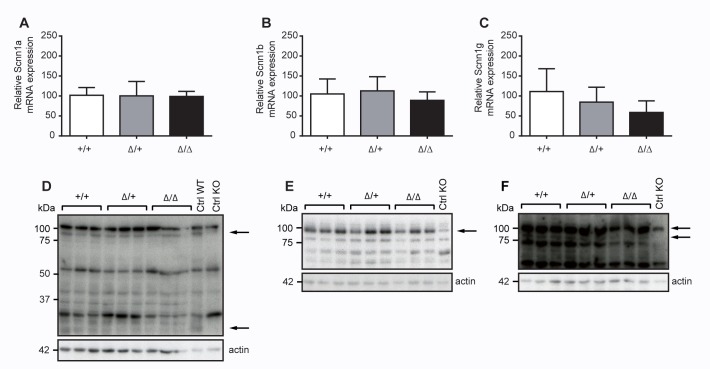
Fig 5. ENaC mRNA transcript and protein expression in kidneys from CAP2/Tmprss4 wildtype (WT), heterozygous mutant (HET) and knockout (KO) mice under regular sodium diet.
(A-C) Relative mRNA transcript and (D-F) ENaC and β-actin protein expression in kidneys of (A) Scnn1a in CAP2/Tmprss4 wildtype (WT, n = 6), heterozygous mutant (HET, n = 7) and knockout (KO, n = 5) mice, (B) Scnn1b in CAP2/Tmprss4 wildtype (WT, n = 6), heterozygous mutant (HET, n = 7) and knockout (KO, n = 5) mice, and (C) Scnn1g in CAP2/Tmprss4 wildtype (WT, n = 6), heterozygous mutant (HET, n = 5) and knockout (KO, n = 5) mice; β-actin was used as internal control. Representative immunoblots of (D) Scnn1a, (E) Scnn1b and (F) Scnn1g and its corresponding β-actin protein expression in CAP2/Tmprss4 wildtype (WT), heterozygous mutant (HET) and knockout (KO) mice; kidney extracts from Scnn1 wildtype (WT) and knockout (KO) mice were used as positive and negative control respectively; arrows indicate the full-length and the corresponding cleaved ENaC fragments.

