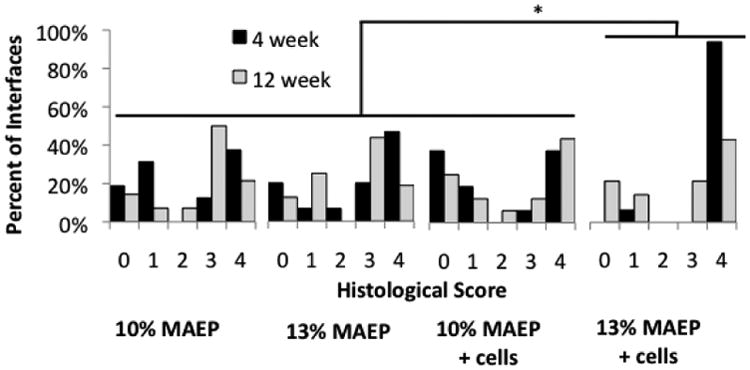
Figure 13.

Scores of histological analysis of tissue response at the bone-scaffold interface using longitudinal center-cut histological sections. * indicates the 13 mol% MAEP + cells group has significantly more direct bone-to-implant contact (score=4) than the other 3 groups (p=0.0002) when evaluated across all time points.
