Figure 4.
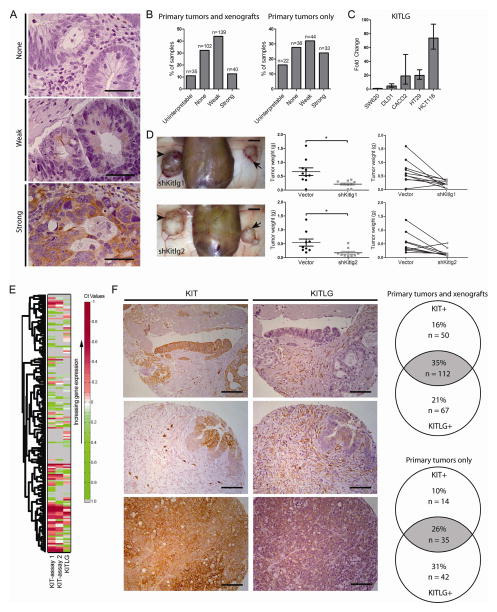
KITLG may signal through KIT in an autocrine and/or paracrine loop. A) Our array of primary colon tumor and xenograft sections was immunostained for KITLG and scored for staining intensity (n = 316 total sections, 137 primary tumors only; bar = 50 μm). Arrows indicate knockdown tumors and arrowheads indicate control B) The number of primary tumors and xenografts for each score was tallied. C) KITLG mRNA levels in several colon cancer cell lines were determined (mean ± 95% CI shown). D) 1×10⁴ viable KIT knockdown DLD1 cells were injected into one flank of NSG mice, paired with control cells in the other flank. Arrows indicate KIT knockdown tumors and arrowheads indicate vector control tumors (left column panels; bar = 0.5 cm). KIT knockdown DLD1 tumors (n = 10 tumors/group) were weighed at post-injection day 30 (middle column panels, mean ± SE shown). The before-after plots (right column panels) show paired tumors from each mouse. E) Single-cell gene expression for tumorigenic CD44+ cells from UM-COLON#8 transduced with the empty vector show individual cells expressing KIT, KITLG, or both. Each row indicates a single cell (n = 128 cells/group), and each column indicates a single gene. F) Selected images from the tumor array demonstrating differences in KIT− and KITLG-staining tumor compartments (bar = 50 μm). The Venn diagram shows the proportion of tumor sections staining positive for KIT and/or KITLG out of all tumor sections (n = 316), or out of primary tumors only (n = 137). *, P < 0.05 in Student t test.

