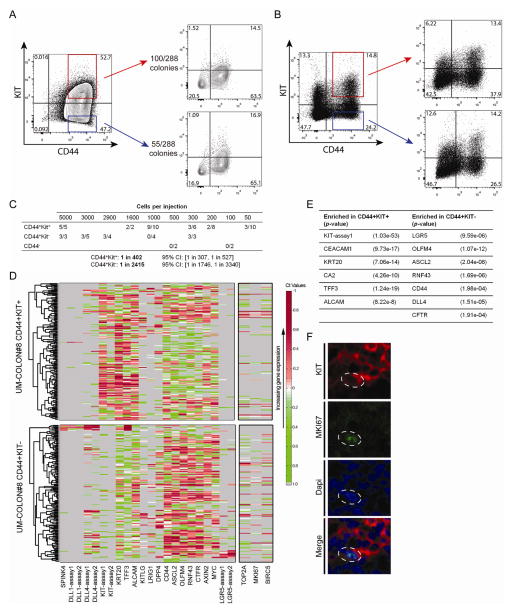
Figure 6.
KIT-expression enriches for the tumorigenic fraction of human colon cancer. A) DLD1 CD44+KIT+ and CD44+KIT− cells were grown as single-cells, and the number of colonies formed was tallied. FACS plots showing that KIT+ or KIT− single-cell colonies recapitulate both KIT+ and KIT− subpopulations. B) Double-sorted UM-COLON#8 CD44+KIT+ and CD44+KIT− cells were injected into flanks of NSG mice, then harvested after 30 days. FACS plots show that both KIT+ and KIT− cells could recapitulate all subpopulations of the parental tumor. C) Limiting dilution experiment showing differences in tumorigenicity for FACS-sorted UM-COLON#8 CD44+KIT+ and CD44+KIT− cells. D) Single-cell qRT-PCR for the indicated genes was performed on double-sorted CD44+KIT+ and CD44+KIT− UM-COLON#8 subpopulations. Proliferation markers (MKI67, BIRC5, and TOP2A; indicated separately) were not included in the clustering. E) Differential gene expression with associated p-values for the data shown in D). P-values were derived using the Wilcoxon rank-sum test. F) Confocal imaging of UM-COLON#8 stained for KIT (red), MKI67 (green), and Dapi (blue) showing that some KIT+ cells express MKI67 (dotted outline). *, P < 0.05 in Student t test.

