
Figure 6.
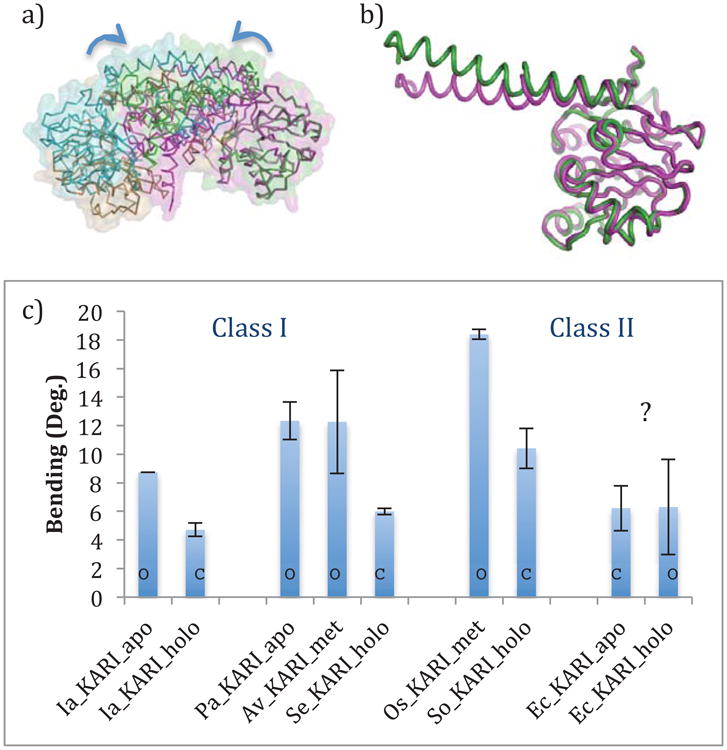
a) An alignment between the apo and holo dimers of Ia_KARI. The structures are aligned based on their rightmost Rossmann domains. The apo structure is shown in green and cyan, and the holo structure is shown in magenta and tan. b) The Rossmann domains and αl-helices of the apo (green) and holo (magenta) crystals of Ia_KARI, showing the change in the bend of the first half of the α1-helix, c) Quantitative analysis of the bending of the first half of the α1-helix. Error bars show standard deviations of the values for multiple chains in the asymmetric unit of the crystal. Bars are denoted with an ‘O’ or a ‘C’ to designate open and closed states of the active site, as assigned visually. Ec_KARI is a clear outlier, both because it goes from a closed to open state upon binding cofactor, and because there is no corresponding change in the α1-helix bending.