
FIGURE 4. Annexin V/PI FACS analyses, TUNEL assay and caspase 3 assay of AdSAT1-transduced and control 293T cells.
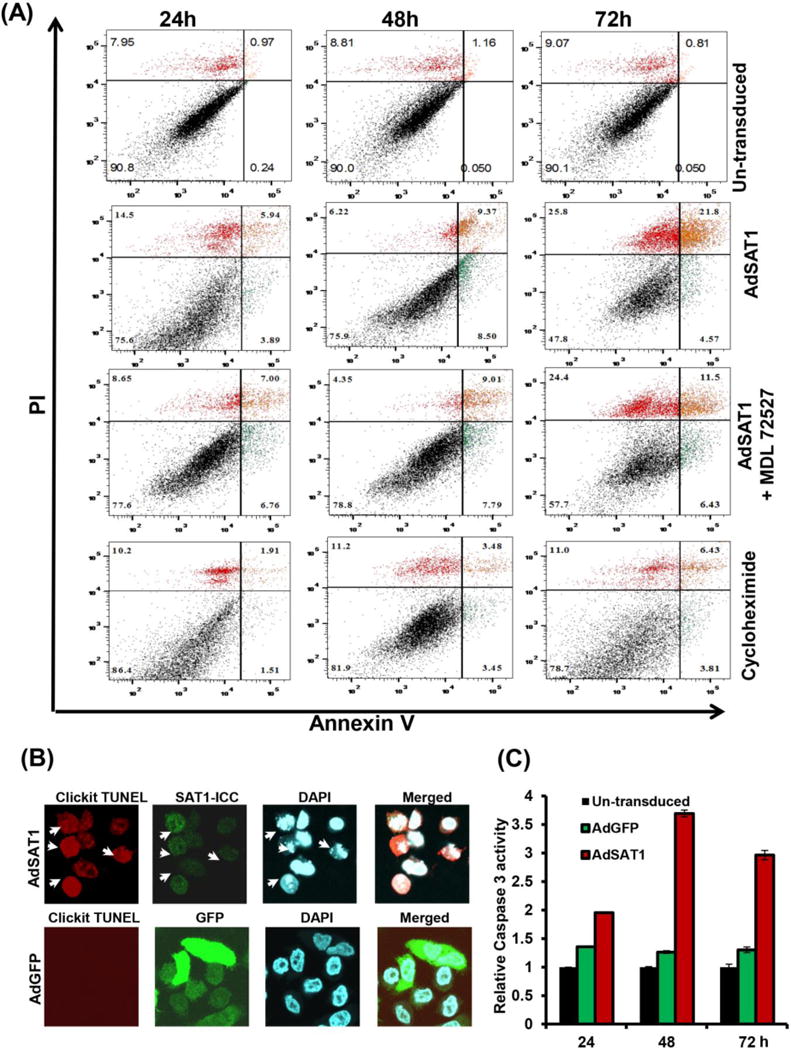
(A) Apoptosis was measured at 24, 48 and 72 h of treatment by FACS analyses using Annexin V-FITC/PI double staining. 100 μM of MDL72527 or 1 μg/ml of cycloheximide was added to the sample as indicated. The percentage of apoptotic cells was calculated from fluorescence dot plots using quadrant statistics (10,000 cells/experiment). One representative experiment is shown. (B) Cells transduced with AdSAT1 or AdGFP were fixed and stained for the TUNEL assay at 48 h as described in Experimental Procedures. After the TUNEL assay, SAT1 immunocytochemistry (SAT1-ICC) was performed. The arrows indicate TUNEL positive cells which coincide with those with high expression of SAT1 and those with nuclear fragmentation upon staining with DAPI. The photomicrographs are representative images from three independent experiments. (C) Caspase 3 activity was measured as described under “Methods” with cell lysates prepared at 24 h, 48 h and 72 h of transduction. Bar graphs show data (mean ± SD) from three independent experiments done in duplicate.