
FIGURE 6. Transmission electron microscopy of untransduced, AdGFP-transduced and AdSAT1-transduced 293T cells.
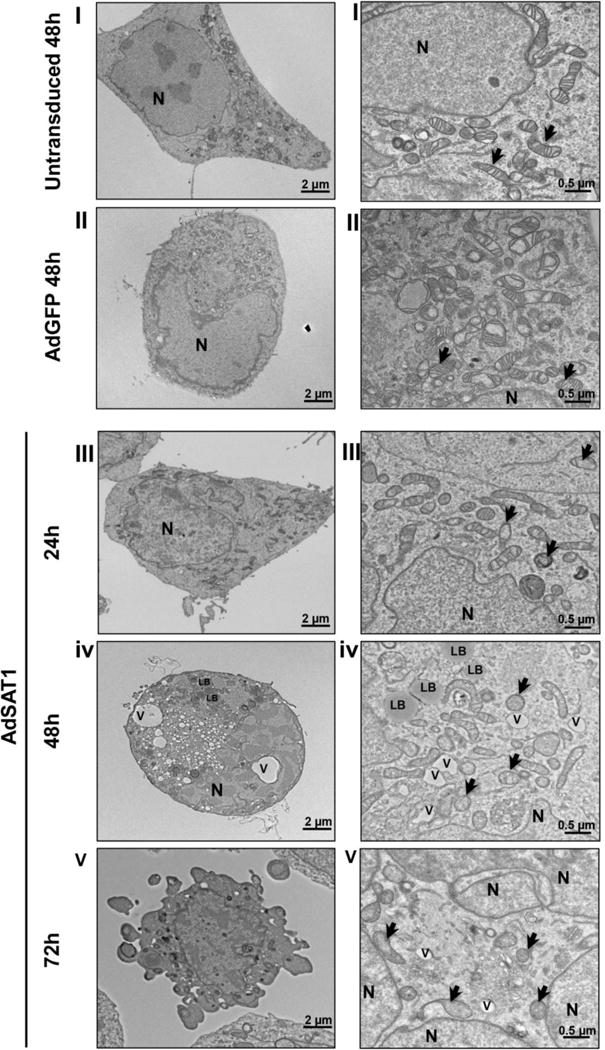
TEM was performed on thin sections of 293T cells, untransduced at 48 h (panel set I), AdGFP-transduced at 48 h (Panel set II) or AdSAT1-transduced at 24, 48 and 72 h (panel sets III, IV and V, respectively). The images on the right side are at higher magnification. Mitochondria are indicated by arrows, nucleus by N, vacuole by V and lipid body by LB. Representative images are shown.