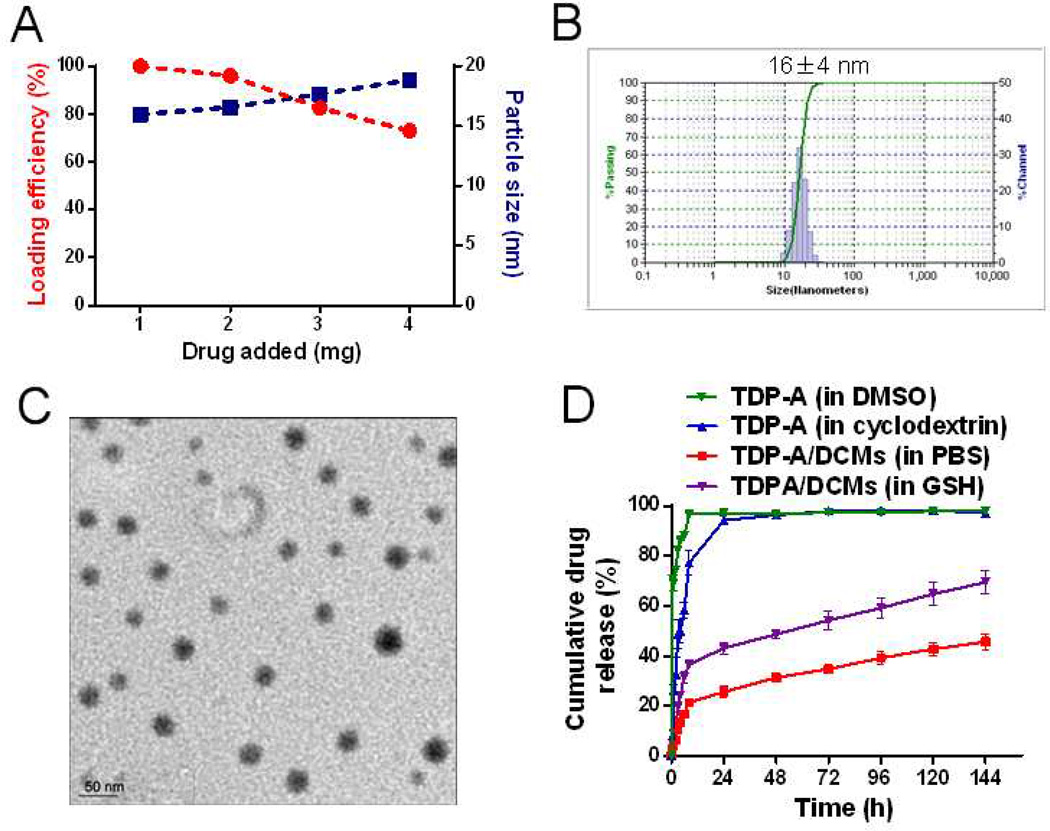
Figure 4.
(A) The loading efficiency and particle size of TDP-A/DCMs versus the amount of drug added at initial loading. The final concentration of the polymers was kept at 20 mg/mL. Representative DLS size distribution (B) and TEM image (C) of TDP-A/DCMs (TDP-A loading was 1 mg/mL; TEM scale bar: 50 nm). (D) Cumulative drug release profile of TDP-A/DCMs in PBS or GSH (10 mM) when compared to that of free TDP-A dissolved in cyclodextrin or DMSO. Values reported are the mean diameter ± SD for triplicate samples.

