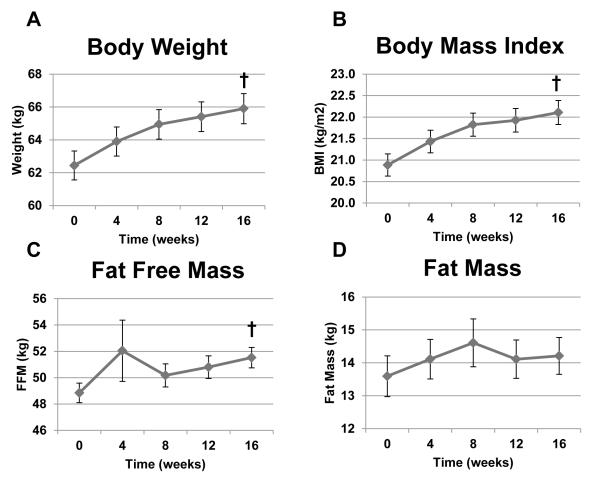
Figure 2.
Body composition indexes in TB patients over time. Panel A: Body weight (kg, p<0.0001). Panel B: BMI (kg/m2, p<0.0001). Panel C: Fat-free mass (kg, p<0.0001). Panel D: Fat mass (kg, p=0.68). One-factor mixed-model repeated-measures analysis of variance was used for statistical analysis. Sample sizes were 191, 170, 165, 145, and 162 for time points 0, 4, 8, 12, and 16 weeks, respectively. Data as mean ± SEM. † Significant effect of time. BMI=body mass index; kg=kilograms.

