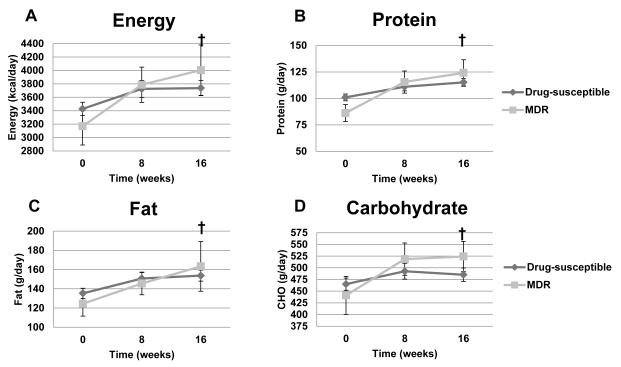
Figure 3.
Mean daily energy, protein, fat and carbohydrate intake in TB patients as a function of drug susceptibility over time. Panel A: Energy (kcal/day, p=0.0077 effect of time; p=0.93 effect of drug susceptibility; p=0.43 for interaction). Panel B: Total protein (g/day, p=0.0003 effect of time; p=0.96 effect of drug susceptibility; p=0.16 for interaction). Panel C: total fat (g/day, p=0.0373 effect of time; p=0.87 effect of drug susceptibility; p=0.77 for interaction). Panel D: Total carbohydrate (g/day, p=0.0327 effect of time; p=0.67 effect of drug susceptibility; p=0.33 for interaction). Two-factor mixed-model repeated-measures analysis of variance was used for statistical analysis. Sample sizes in the drug-susceptible group were 168, 143, and 132 for time points 0, 8, and 16 weeks, respectively; sample sizes for the MDR-TB group were 23, 17, and 14 for time points 0, 8, and 16 weeks, respectively. † Significant effect of time. MDR-TB= Multi-drug resistant-TB.

