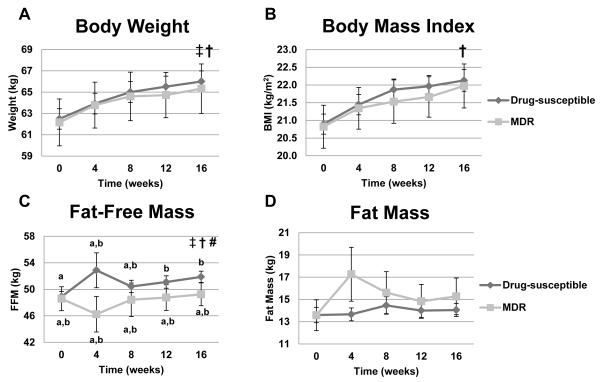
Figure 4.
Body composition indexes in TB patients as a function of drug susceptibility over time. Panel A: Body weight (kg, p<0.0001 effect of time, p= 0.048 effect of drug susceptibility; p=0.91 for interaction). Panel B: BMI (kg/m2, p<0.0001 effect of time; p= 0.10 effect of drug susceptibility; p=0.76 for interaction). Panel C: Fat-free mass (kg, p =0.0502 effect of time, p =0.0070 effect of drug susceptibility and p= 0.0249 for interaction). Given the interaction effect, pairwise comparisons were made over time between the two TB groups at each time point for fat-free mass. Values for fat-free mass at individual time points within and between the two drug-susceptibility groups that do not share the same letters are significantly different. Panel D: Fat mass (kg, p =0.17 effect of time, p =0.69 effect of drug susceptibility and p= 0.68 for interaction). Two-factor mixed-model repeated-measures analysis of variance was used for statistical analysis. Sample sizes for drug susceptible group were 168, 153, 147, 131, and 145 for time points 0, 4, 8, 12, and 16 weeks, respectively; sample sizes for the MDR-TB group were 23, 17, 18, 14, and 17 for time points 0, 4, 8, 12, and 16 weeks, respectively. † Significant effect of time, ‡ Significant effect of drug-susceptibility,# significant interaction between time and drug-susceptibility.

