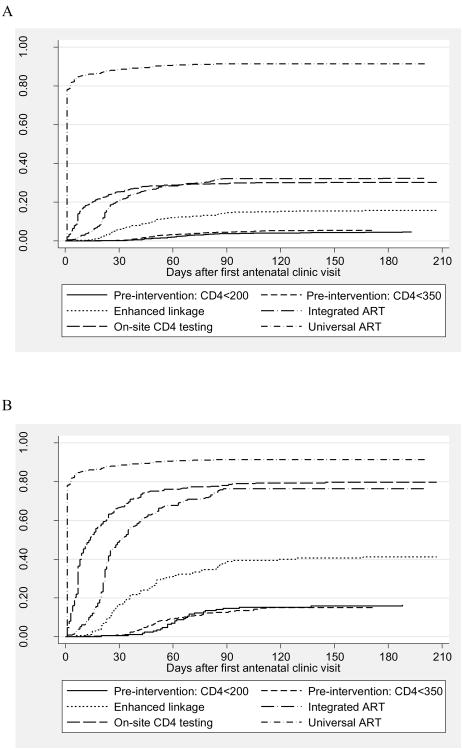
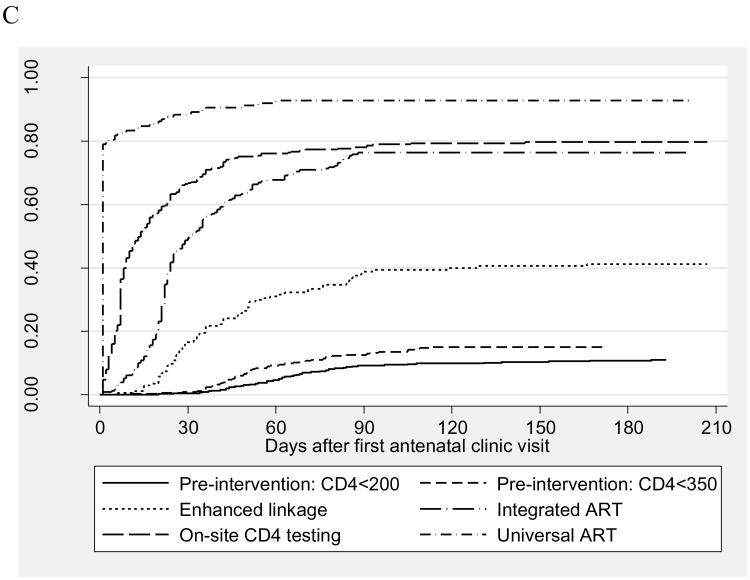
Figure 3.
Kaplan-Meier “failure” plots of time from the start of antenatal care to ART initiation before delivery, by service delivery model, for (A) all HIV-infected pregnant women, (B) for ART-eligible women (as defined by the service delivery model), and (C) for women with CD4 cell counts ≤350 cells/μl.
A. All HIV-infected pregnant women
B. ART-eligible women, as defined by the service delivery model
C. Women with CD4 ≤350 cells/μl


