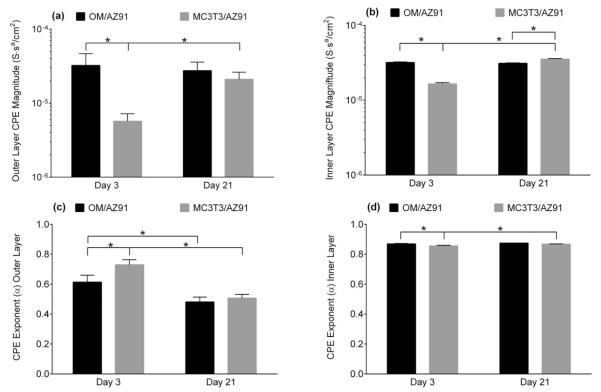
FIGURE 4.
Plots of the outer layer (a, c) and inner layer (b, d) of the CPE magnitude (a, b) and the CPE exponent (c, d) measured from EIS. The data are plotted as the mean ± 1 standard deviation of three independent samples for each group. *Indicates statistical difference (p < 0.05) between groups.

