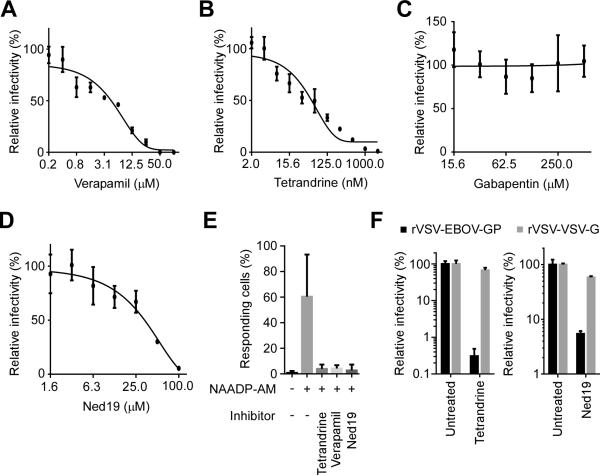
Fig. 1. Inhibitors of NAADP signaling block EBOV infection.
Dose response curves for verapamil (A), tetrandrine (B), gabapentin (C) and Ned19 (D) were determined by pretreating HeLa cells with the indicated doses of each compound and then infecting with a recombinant EBOV encoding GFP as a marker of infection (EBOV-GFP). Infection efficiencies were calculated by dividing the numbers of GFP positive cells by those of total cells and normalizing the infectivity to untreated cells (mean ± SD, n = 3). Each data set is representative of three independent experiments. (E) The impact of the indicated compounds on NAADP-stimulated calcium release was measured by stimulating cells with 1 μM NAADP-AM (30, 31) or control DMSO and imaging cell fluorescence after addition of the calcium sensitive dye, Fluo-4. Cells showing Fmax/F0 > 2 (Fmax: maximum fluorescence intensity, F0: mean fluorescence intensity before stimulation) were counted as responsive cells. At least 800 cells were analyzed for each treatment and data averaged over 3 experiments ± SD. (F) Pseudotyped viruses bearing the glycoproteins of EBOV (rVSV-EBOV-GP) or VSV (rVSV-VSV-G) and encoding firefly luciferase as an infection marker were used to show entry dependence of EBOV on NAADP signaling. Cells were treated with tetrandrine (2 μM) or Ned19 (100 μM), and then infected with either pseudotyped virus. Luciferase activities were normalized to untreated controls.

