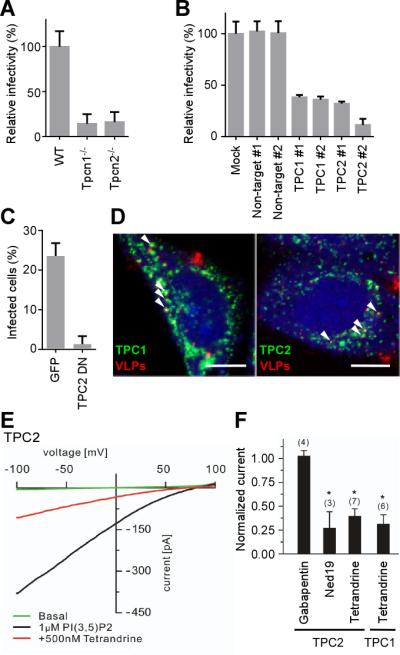
Fig. 2. The endosomal calcium channels TPC1 and TPC2 are necessary for EBOV infection.

(A) Mouse embryonic fibroblasts (MEFs) from WT, Tpcn1−/− or Tpcn2−/− mice (25, 32) were infected with EBOV-GFP. The frequency of GFP positive cells in the total cell population was normalized to total cells. (B) HeLa cells were transfected with either two independent non-targeting, TPC1-specific or TPC2-specific siRNAs and infected with EBOV-GFP. The frequency of GFP positive cells in the total cell population was normalized to mock-transfected cells. (C) HeLa cells overexpressing a dominant negative form of TPC2 (L265P) tagged with GFP were infected with WT EBOV. Cells expressing GFP alone were used as control. Infected cells were detected using anti-EBOV GP antibody. The proportion of cells showing GFP fluorescence that were infected was calculated. All data for (A), (B) and (C) are mean ± SD (n = 3) and representative of three independent experiments. (D) Colocalization of Ebola VLPs with TPC1 or TPC2 was determined by incubating VLPs (red) for 2 h with cells transfected with TPC1 or TPC2 tagged with GFP (green). Colocalized particles were indicated by arrowheads. Scale bars, 10 μm. (E) Whole endolysosomal currents were recorded from TPC2-expressing HEK293T cells using modified conventional patch-clamp with PI(3,5)P2 (33-35). Current-voltage relations were recorded in the presence or absence of tetrandrine (500 nM). (F) Bar diagram summarizing data of current amplitude of TPC2 or TPC1 in the presence of gabapentin (100 μM), Ned19 (200 μM) or tetrandrine (500 nM), normalized to those before drug application. * indicates P < 0.001 using Student's t test, compared to current in the presence of gabapentin for TPC2 or without inhibitors for TPC1. Data are mean ± SEM.
