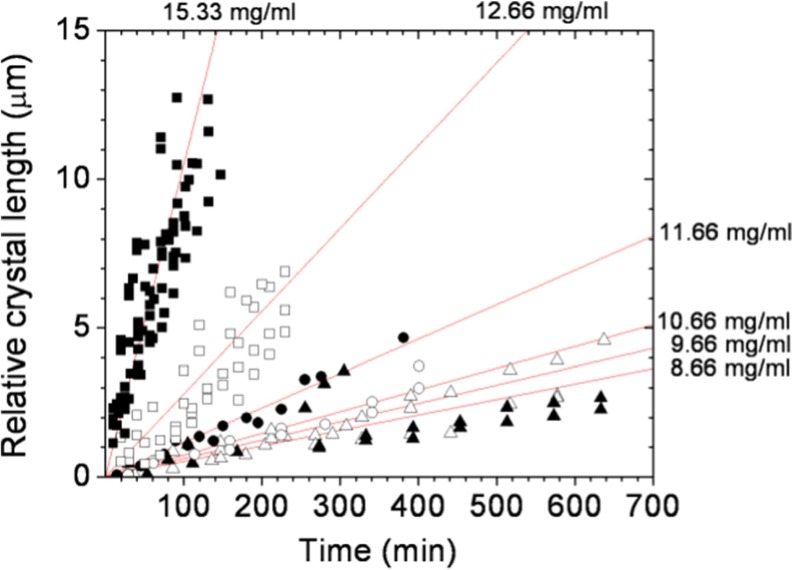
Fig. 5.
Time dependence of the relative crystal length at the early stage of crystal growth. Each solid line represents the averaged linear fit over growth rates of several individual lysozyme crystals. Lysozyme concentrations: △ - 8.66 mg/ml; ▲ - 9.66 mg/ml; ○ - 10.66 mg/ml; ● - 11.66 mg/ml; □ - 12.66 mg/ml; ■ - 15.33 mg/ml

