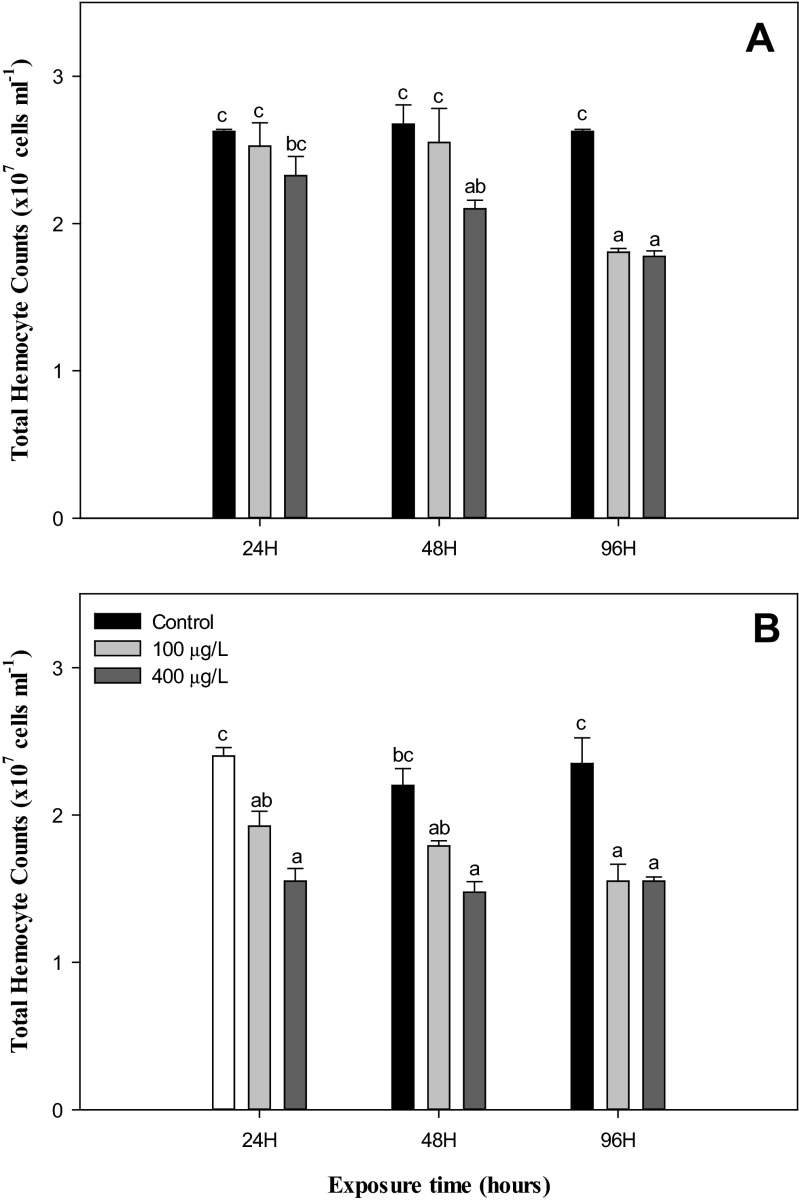
Fig. 1.
Total hemocyte counts in abalone, H. discus hannai Ino, exposed to various NiCl2 concentrations at 22 °C (a) and 26 °C (b) for 96 h. Each point represents a mean value ± SD of three replicates. Vertical bar denotes a standard error (n = 5). Values with different superscripts are significantly different (P < 0.05) as determined by Duncan’s multiple range test

