
FIG 3.
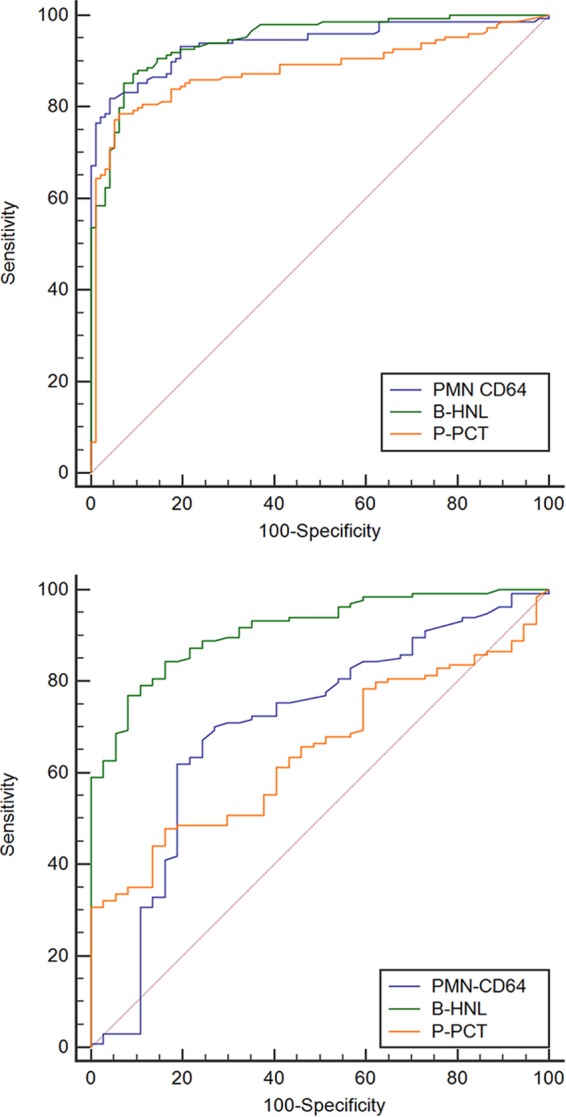
Receiver operating characteristic curves of B-HNL, expression of CD64 on PMN, and plasma PCT (P-PCT) in the discrimination between healthy noninfected subjects and patients with bacterial infections (top), and between patients with bacterial and viral infections (bottom). The areas under ROC curve results are summarized in Table 3.