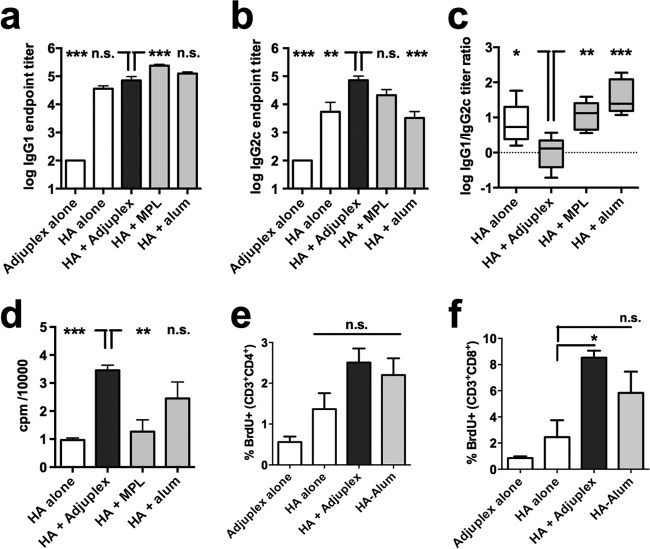
FIG 3.
B- and T-cell activity induced by immunization. (a to d) Mice (C57BL/6, 5 per group) were immunized for the experiment with results shown in Fig. 2, and HA-specific IgG1 (a) and IgG2c (b) endpoint titers were determined. (c) Box (interquartile range) and whisker (complete range) plots of the ratio of IgG1 to IgG2c titer. (d) Splenocytes were harvested on day 38 postprime, and HA-specific responses were assayed by [3H]thymidine incorporation. (e and f) Splenocytes from mice immunized with Adjuplex alone, HA alone, or in Adjuplex or alum were HA pulsed in vitro, fixed and labeled for incorporated nuclear BrdU and surface CD3 and either CD4 or CD8, and analyzed by flow cytometry. (a, b, and d to f) Data represent the mean ± SEM. *, P < 0.05; **, P < 0.01; ***, P < 0.001; n.s., not significant.

