
FIG 3.
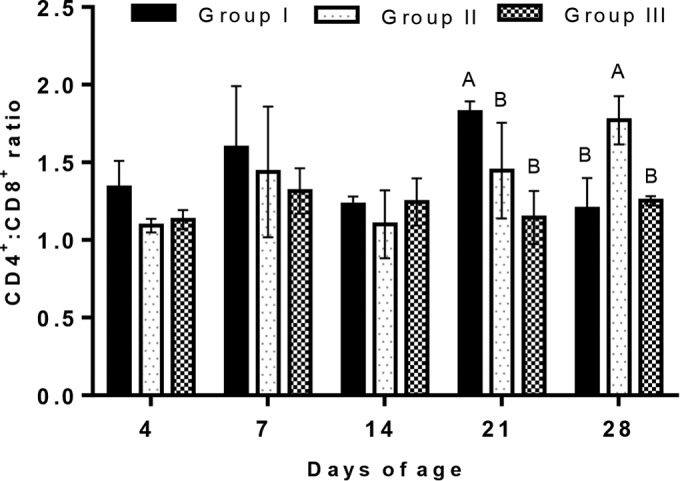
The ratio of CD4+/CD8+ cells analyzed by flow cytometry in the peripheral blood of chickens vaccinated with live H120 alone (group I) or in combination with CR88 (group II) at day 1. The two groups were again vaccinated with CR88 at 14 days of age. One group (group III) was kept as a control. Depicted are the mean values (n = 5 per group) and one standard error. Significantly (P < 0.05) different values are shown with different letters, and all other values were not significantly (P < 0.05) different between the groups at those time points.