
Figure 1.
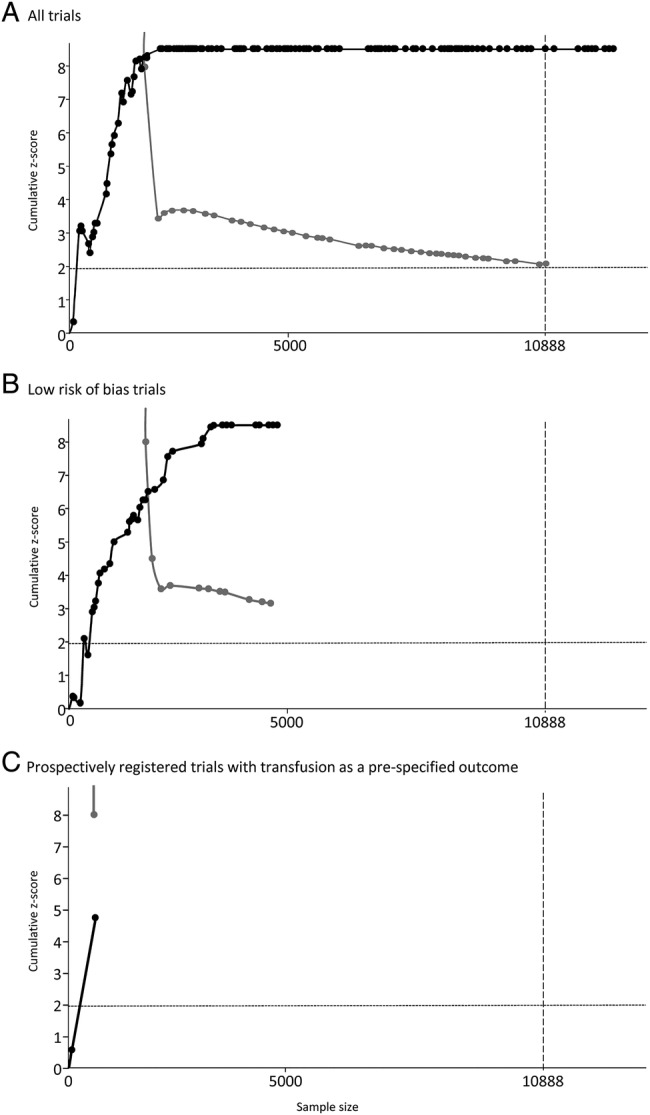
Results of trial sequential analyses for (A) all trials, (B) trials at low risk of bias and (C) low risk of bias trials with transfusion prespecified on prospective registration record. For each analysis an information size is calculated on the basis assuming α=5%, β=10%, control group event rate of 40%, relative risk reduction of 15% and anticipated maximum heterogeneity of I2=75%. The solid black line illustrates the cumulative z-curve, the solid grey line shows the trial sequential monitoring boundary.