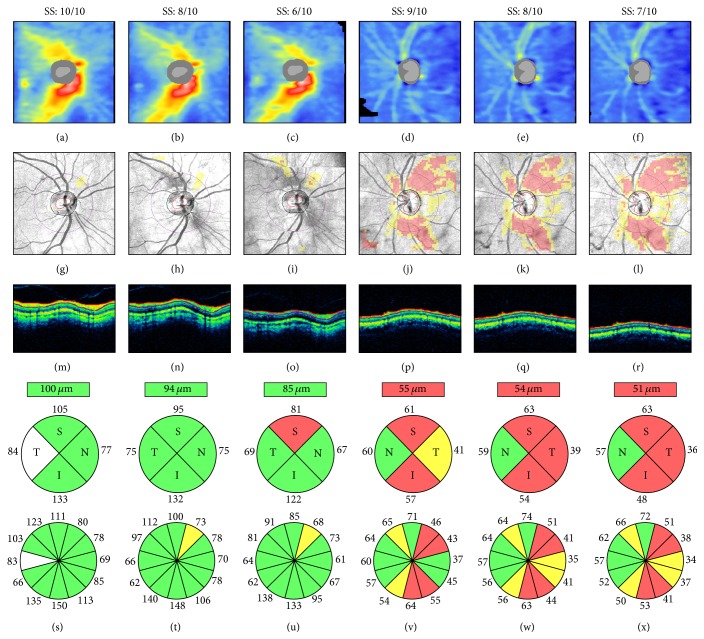
Figure 6.
Signal strength and retinal nerve fiber layer (RNFL) thickness. Cirrus HD-OCT RNFL thickness maps ((a)–(f)), RNFL deviation maps ((g)–(l)), circular tomograms ((m)–(r)), and printout results ((s)–(x)) from two eyes. All scans had signal strength ≥6, the cut-off for acceptable image quality. Both cases show progressive signal attenuation ((m)–(o) and (p)–(r)), RNFL thinning and classification changes ((s)–(u) and (v)–(x)), and worsening of the RNFL thickness maps and RNFL deviation maps as signal strength decreases. Left: scans collected within a 2-week interval and sorted by decreasing signal strength; note the superotemporal reduction of the warmed-colored areas on the RNFL thickness maps, indicating RNFL thinning ((a)–(c)), and the corresponding clusters of “superpixels” on the RNFL deviation maps ((g)–(i)). Right: scans collected consecutively on the same day; note the progressive inferotemporal expansion of the “superpixels” cluster on the RNFL deviation maps ((j)–(l)). SS: signal strength.

