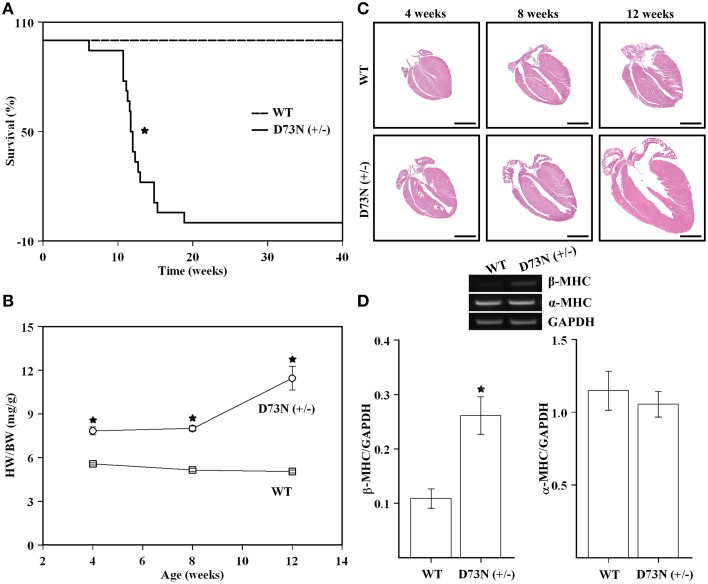
Figure 4.
Effect of the D73N mutation on survival, heart weight to body weight ratios, overall cardiac morphology, and expression of a molecular marker of cardiac hypertrophy. (A) Kaplan-Meier survival curves for WT (n = 31) and D73N (+/−) (n = 18) mice. The log-rank test indicated statistically significant difference between the two curves (*p < 0.0001). (B) Comparison of heart weight to body weight ratios between 4 ± 0.1, 8 ± 0.4, and 12 ± 0.4 week old WT and D73N (+/−) mice. Data represent mean ± S.E. for at least seven mice per group. (C) Representative images of longitudinal heart sections of 4 ± 0.1, 8 ± 0.4, and 12 ± 0.4 week old WT and D73N (+/−) mice, stained with H&E. Scale bar = 2 mm. (D) RT-PCR analysis of total RNA isolated from the hearts of WT and D73N (+/−) mice. Total RNA was isolated from the left ventricular myocardium of 8 ± 0.4 week old mice and subjected to RT-PCR. The top panel shows representative images of amplification for β-MHC, α-MHC, or GAPDH mRNAs, respectively. The bar graphs show the ratio of β-MHC or α-MHC to GAPDH. Data represent the mean ± S.E. for four hearts per genotype. *D73N (+/−) values significantly different from their respective WT values (p < 0.05).

