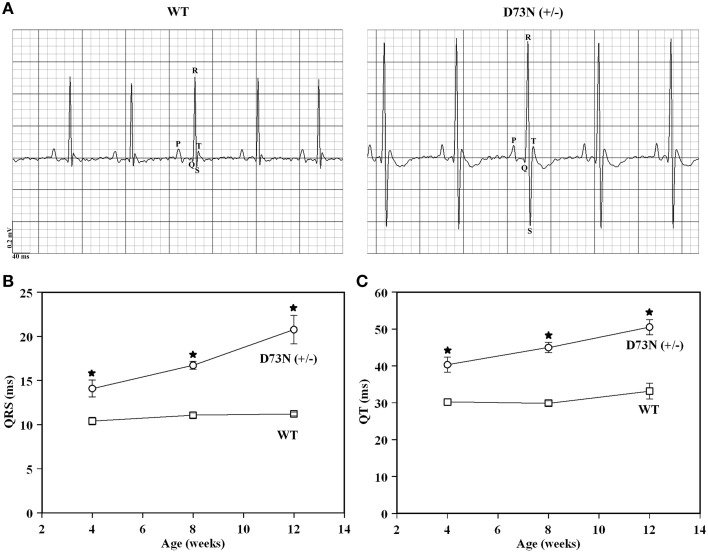
Figure 7.
Effect of the D73N mutation on electrocardiographic parameters. (A) Representative ECG tracings from 8 ± 0.4 week old WT and D73N (+/−) mice. (B) Comparison of QRS intervals between 4 ± 0.1, 8 ± 0.4, and 12 ± 0.4 week old WT and D73N (+/−) mice. Data represent mean ± S.E. for at least 11 mice per group. (C) Comparison of QT intervals between 4 ± 0.1, 8 ± 0.4, and 12 ± 0.4 week old WT and D73N (+/−) mice. Data represent mean ± S.E. for at least 11 mice per group. *D73N (+/−) values significantly different from their respective WT values (p < 0.05).

