
FIGURE 2.
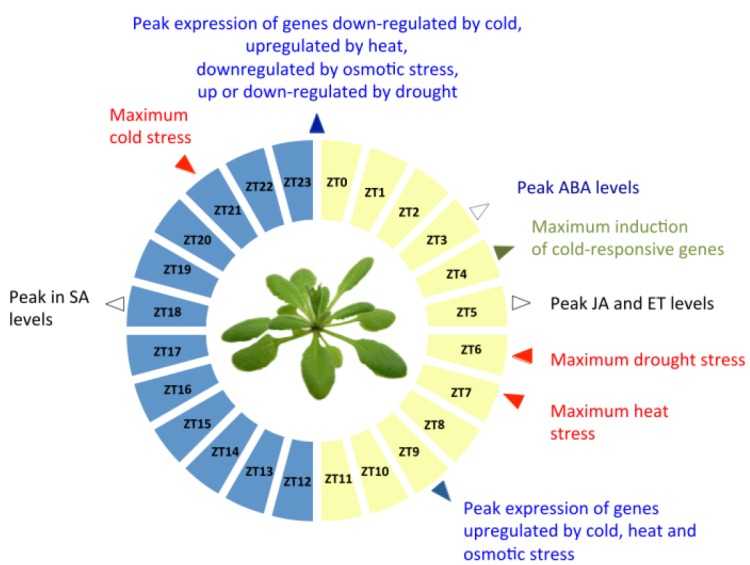
Timing of abiotic stress responses across the day-night cycle. The times of the day at which different types of abiotic stress are most prominent in the natural environment are indicated in red. For each type of environmental stress, the time of peak basal expression for the majority of stress-responsive genes is indicated in blue, the time of maximum accumulation of stress response hormones is shown in black, and the time of maximum responsiveness to different environmental signals is shown in green.