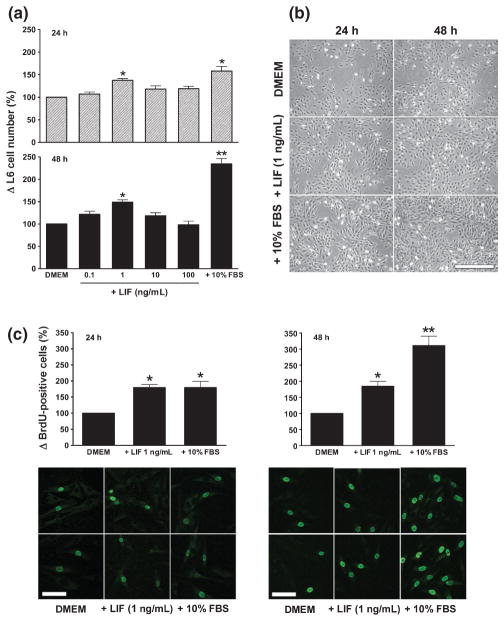
Fig. 3.
Changes in (a, b) the number of L6 cells and (c) bromodeoxyuridine (BrdU) incorporation in response to leukaemia inhibitory factor (LIF). (a) The number of L6 cells 24 and 48 h after LIF treatment with different concentrations, as indicated, was compared with that in serum-free medium (Dulbecco’s modified Eagle’s medium; DMEM) and growth medium (DMEM + 10% fetal bovine serum; FBS). Graphs were plotted from data obtained from three separate experiments and show the mean ± SEM. (b) Representative images of cells cultured in DMEM, DMEM + LIF 1 ng/mL and DMEM + 10% FBS at 24 and 48 h. Bars, 200 μm. (c) The number of BrdU-positive cells at 24 and 48 h after treatment with DMEM + LIF 1 ng/mL was compared with that in cells cultured in serum-free medium (DMEM) and growth medium (DMEM + 10% FBS). The number of BrdU-positive cells was determined in 10 random images for each treatment group in each experiment. Graphs were plotted from data obtained from three separate experiments and show the mean ± SEM of values expressed as a percentage of values in the control (DMEM) group. *P < 0.05, **P < 0.01 compared with DMEM (one-way ANOVA and Tukey’s post hoc test). Two representative images of BrdU-positive cells from each treatment group at 24 and 48 h are shown beneath the graphs. Bars, 50 μm.

