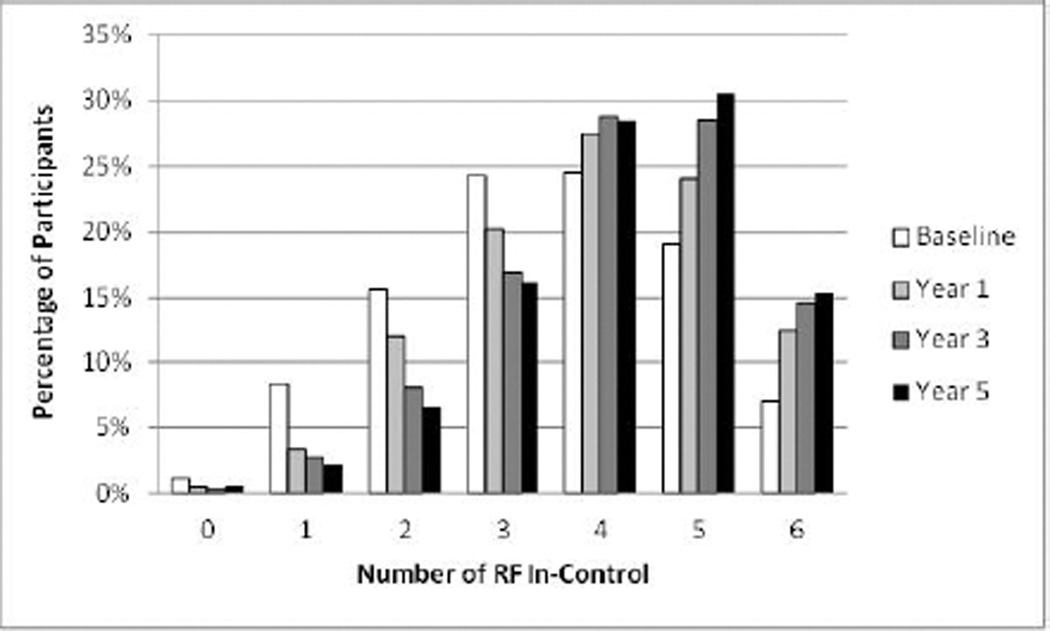
Figure 1. Distribution of the Number of RFs In Control: Baseline to Year 5.
The numbers of RFs in control are shown at baseline and for each year of the trial. Over time, the proportion of participants with 4 or more RFs in control increased while the proportion with fewer RFs in control declined.
RF = risk factor.

